When exploring the unknown it makes sense to be guided by expectation, but simultaneously to keep one’s eyes wide open for the unexpected.
This open approach is taken in the PowerFlux all-sky search for continuous gravitational waves, the full details of which are described in a recent publication. Here we summarise the main findings of that publication.
From a conventional point of view, the most likely source of continuous gravitational waves are not-quite-spherical rotating neutron stars. We have known these objects exist ever since they were first observed as pulsars. The fastest known neutron stars rotate several hundred times per second and, if asymmetric enough, are just right to be picked up by the LIGO interferometers.
The received signal from such a gravitational wave source lies in the audio frequency range, so it can be played by your computer speakers. Because the neutron stars are rotating in near-vacuum we expect to hear a perfect tone at a single pitch, except for some inevitable loss of signal fidelity in the interferometers and a very gradual change in pitch due to movement of the star or energy loss. But this change in pitch is so subtle that we need more sensitive instruments than the human ear to measure it.
Taking a wider look
While some searches look for signals from known pulsars, it makes sense to search the sky for those we do not know about. This is because a radio pulsar is seen only if its magnetic north or south pole points in our general direction during part of the rotation, so that we can receive the strong signals. There could be many neutron stars not pointing toward us – or not emitting strong radio waves at all. It is also possible to detect pulsars in X-rays and gamma-rays.
Radio, X-ray and gamma-ray signals from a pulsar can be obscured due to intervening matter, while gravitational waves from the pulsar would not be blocked.
In our publication we describe the results of a particular search that scans the entire sky and across a wide range of pulsar parameters. The search method is known as PowerFlux and was applied to data from the sixth science run (known as S6) carried out by the initial LIGO interferometers.
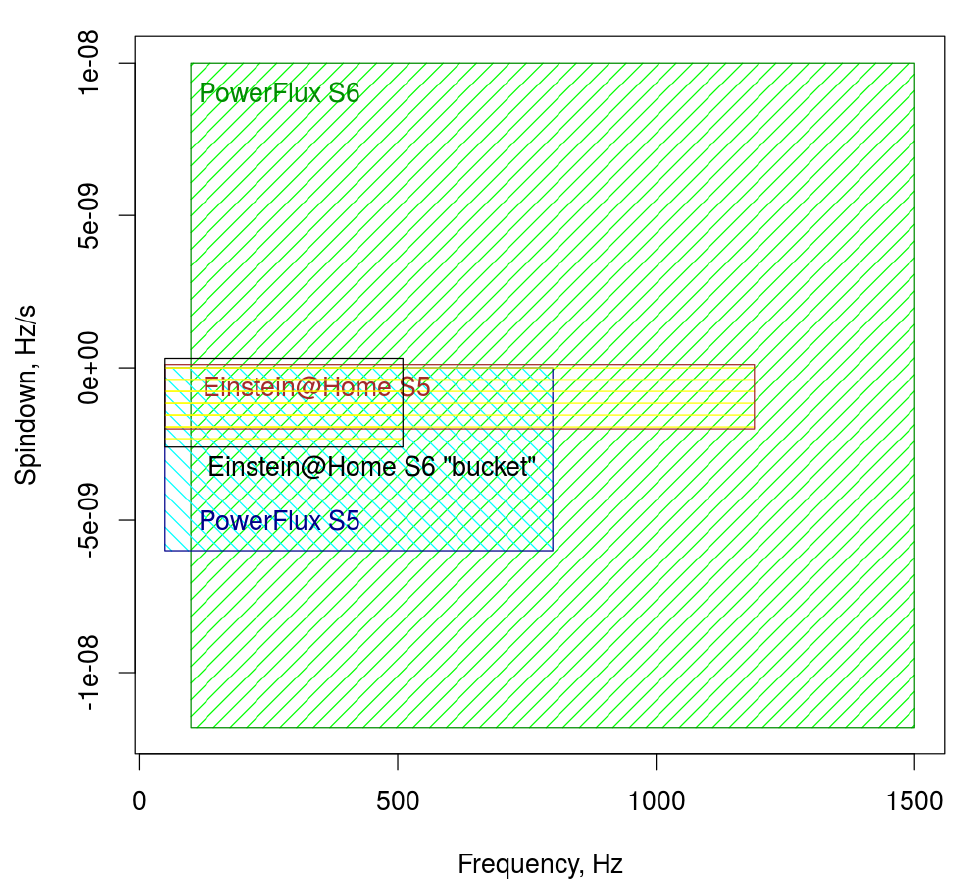
It makes sense to search a wide range of frequencies and allow for different rates of energy loss. In fact, we went even further and allowed for a significant increase in apparent source frequency. This is physically possible if the neutron star is in a long-period orbit with another star. The parameter coverage of our PowerFlux S6 all-sky search is illustrated in the Figure 1 shown here, which is Figure 5 of our publication.

Figure 1: Here the rectangles indicate the parameter ranges searched by different methods – both in frequency and in spindown rate, which measures the change in frequency during one second. The PowerFlux S6 survey covers the widest range of parameters explored to date, including a search for increases in frequency due to the orbit of a neutron star around a long-period companion star.
Did we find anything?
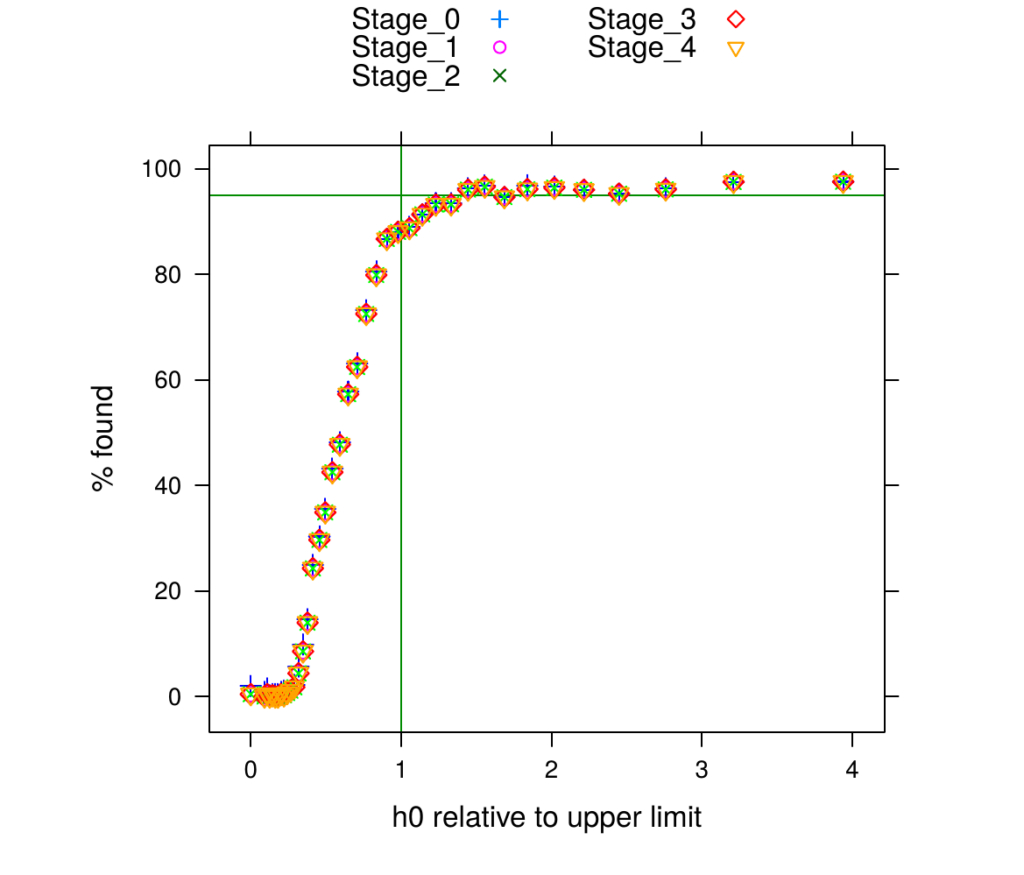
It is all well and good to search a large parameter space, but it is equally important to understand what we can and cannot expect to find from that search. To test our analysis method, we performed a simulation where unknown signals were injected into LIGO data, and we attempted to find them. Figure 2 shown here, adapted from Figure 3 of our publication, shows the results of this simulation.

Figure 2: Here we summarize the results of testing our analysis pipeline using simulated injections of pulsar-like signals at frequencies between 400 Hz and 1500 Hz. The signals were injected at the start of the analysis and their recovery was checked at five different points in our pipeline, labeled Stage_0 through Stage_4. By injecting simulated signals into the LIGO data and then attempting to use our analysis pipeline to find them, we found that we have a 95% chance of recovering test signals that have a randomly chosen frequency between 400 Hz and 1500 Hz.
We also tested our analysis pipeline by injecting simulated signals directly into the interferometer apparatus. Some of these were very weak and below the sensitivity shown in Figure 2. Others were stronger and were easily found.
A handful of outliers other than injections passed the analysis as well. These were very carefully investigated and found to be due to very strong disturbances in the interferometers themselves.
Upper limits on neutron star deformations
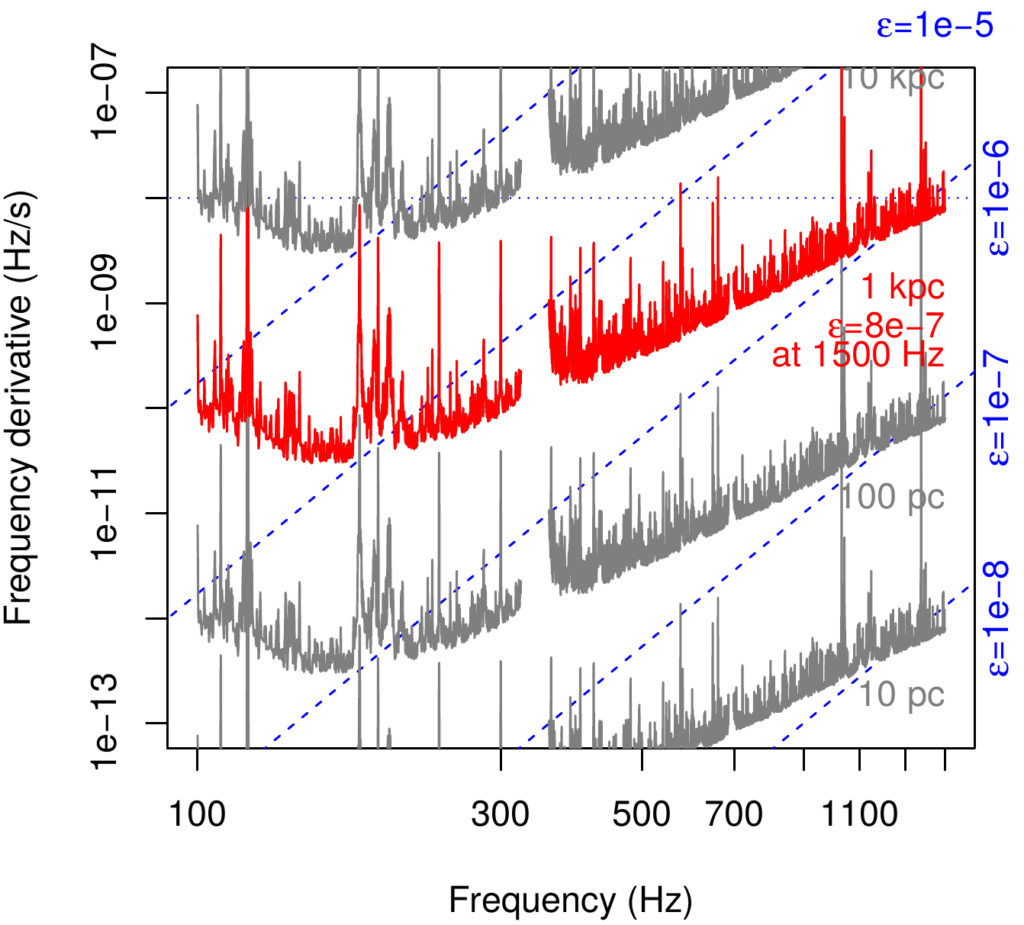
In the absence of a detection, we were able to place bounds on how asymmetric neutron stars can be – reasoning that if neutron stars were any more asymmetric than this then a gravitational-wave detection would have been made. Some results from this analysis are shown in Figure 3 here, which is Figure 6 of our publication. The degree of asymmetry of the neutron star is described by a technical parameter called “ellipticity” – which roughly can be thought of as the ratio between the size of deformation (or “mountain”) on the neutron star compared to the size of the star istelf. Neutron stars with an ellipticity as large as 1e-5 are calculated to be stable, although we don’t know of any natural process that would produce an ellipticity this high.

Figure 3: This plot shows the maximum reach of the PowerFlux all-sky search. For example, suppose one is interested in a 1-kiloparsec horizon around frequencies of 1500 Hz. Then the red curve on the graph indicates that we would need a neutron star with ellipticity of at least 8e-7, optimally oriented towards us, to have had a chance of detecting a gravitational-wave signal.
Constraints like this are useful and allow us to translate search sensitivity (usually reported in units of gravitational-wave strain) to physical parameters of potential neutron stars. For example, reading off the plot at 1500 Hz we learn that we could have detected a neutron star, of a typical 14 km diameter, one thousand parsecs (or about 3200 light years) away, provided its axis was pointed at us and it was deformed from a perfectly spherical shape by less than one part in a million – corresponding to a (broad) bulge on its surface less than 1 cm (or half an inch) in height.
Read more:
- Freely readable preprint of the paper describing the details of the full analysis and results: “Comprehensive All-sky Search for Periodic Gravitational Waves in the Sixth Science Run LIGO Data”.
- Neutron star

