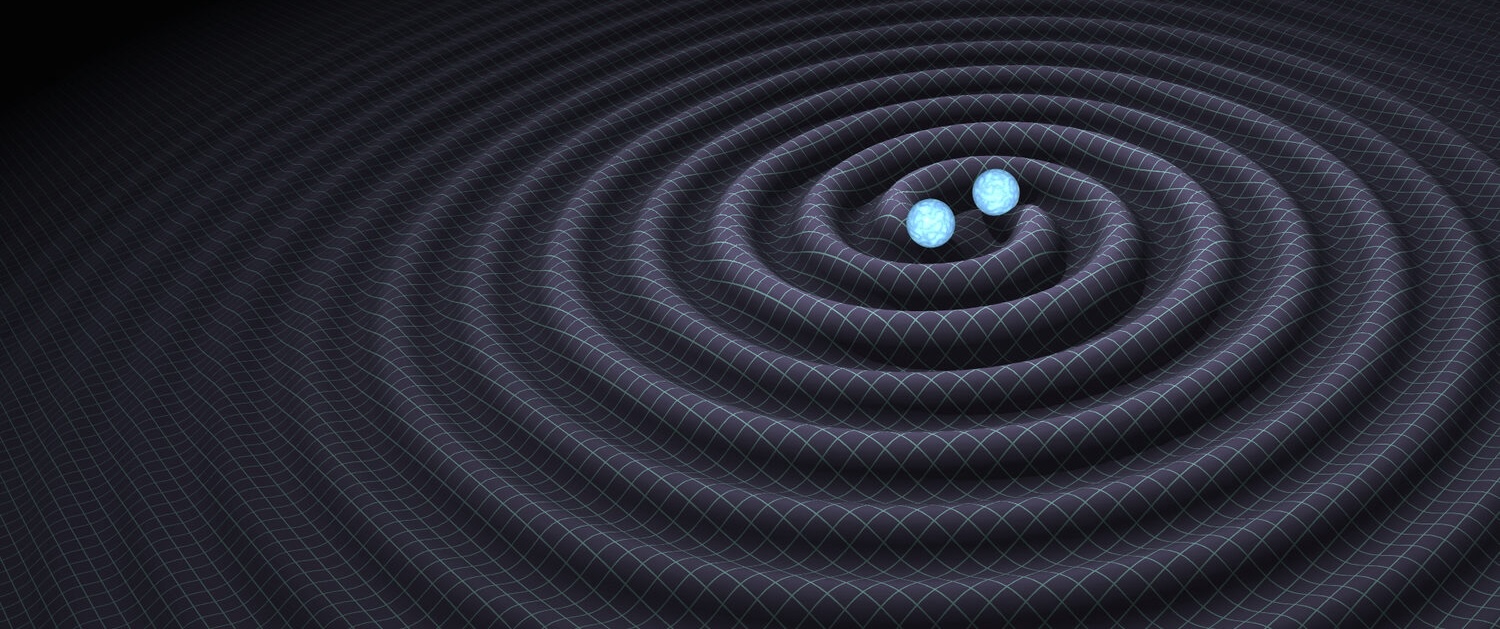
The LIGO and Virgo gravitational-wave detectors have been hunting for signals from the collisions of neutron stars and black holes, which are dense objects formed from the remains of stars many times more massive than our Sun. When two of these objects orbit each other in a binary system, the emission of gravitational waves will gradually carry away some of their orbital energy, forcing them to get closer and closer together. This happens slowly at first, but as the orbit gets tighter the gravitational waves get stronger and the process accelerates until eventually the stars collide and merge, emitting in the last few seconds one of the most powerful outflows of energy in the Universe.
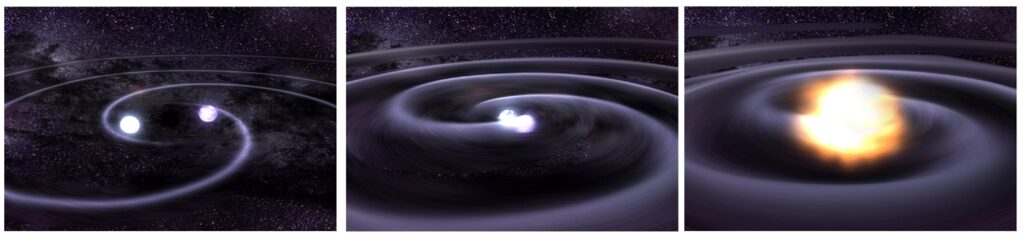
An artist’s impression of two stars orbiting each other (left). The orbit shrinks as the system emits gravitational waves (middle). When the stars merge (right), there is a resulting powerful emission of gravitational waves. (Image: NASA)
When neutron stars are involved, the collisions may be responsible for extremely powerful short gamma ray bursts. Gamma ray bursts are among the most distant events ever detected, and a simultaneous gravitational-wave observation will allow us to identify the system at their origin. While when two black holes collide the event can be impossible to detect with electromagnetic observatories since there is no material to shine. When gravitational waves from merging black holes and neutron stars finally reach the Earth, they are extremely weak, but they provide us with specific information that light cannot give. These powerful gravitational-wave sources are among the prime candidates for detection with ground-based gravitational-wave detectors, but once found (for instance by a search like this), what can the gravitational waves tell us about the stars and black holes that meet their fate this way?
Fortunately, the gravitational waves emitted by binary mergers are not random bursts of energy, but are instead highly structured waveforms that carry a lot of information about the progenitor systems to those who can interpret them. The masses of the two inspiraling objects, their spins (how fast they are rotating around their own axes), the location of the binary on the sky and its distance from Earth are all imprinted onto the signal recorded by the gravitational-wave detectors:
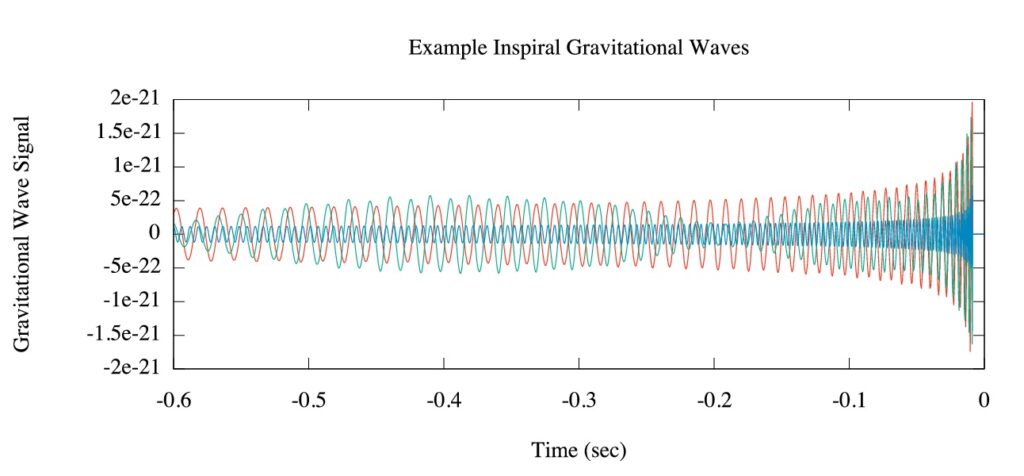
- First, the red signal comes from a system of two black holes of mass 10M⊙ and 5M⊙ that are not spinning.
- Second, the green signal is for black holes with the same masses, but now with each of the two components spinning.
- Finally, the blue signal comes from a system of two neutron stars each with mass equal to 1.4M⊙, which aren’t spinning.
However, the data from the detectors contain random noise in addition to possible gravitational-wave signal like the ones above, which is generally louder than the signals:
Noise in the detector: here the actual data from the detector is shown in gray. The noise is much louder than the expected signals in red, green and blue (from the figure above, superimposed on the gray noise signal).
We can still determine which gravitational-wave signal is buried in the noise by comparing the signal we receive with theoretical “template” signals that would be produced by the different types and configurations of sources. But rather than examine every possible template (there are many billions of possibilities), we use computer algorithms which explore the range of possibilities, with the similarity between template and prediction telling us whether we are “warmer” or “cooler” in the hunt for the true signal:
Using the LIGO supercomputing facilities, we ran these algorithms for a number of test signals that cover the three main classes of binaries that LIGO and Virgo are sensitive to: two neutron stars, two black holes, or a neutron star orbiting a black hole. We looked at systems with different masses, with both spinning and non-spinning components, and with different signal strengths. To check that our end-to-end analysis worked from the instrument to the final results, we added test signals to the detectors by physically moving the mirrors, simulating the effect of a passing gravitational wave. These included one signal that was added secretly without the knowledge of the collaboration as a whole (the “blind injection challenge”).
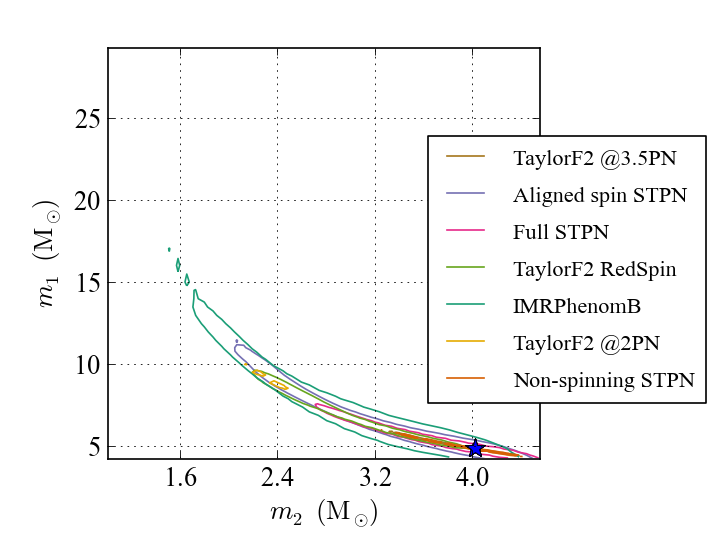
This plot shows the most probable values of the binary system’s masses: for each of the 7 models there is a 90% chance of the true masses lying inside the respective contour line. The blue star marks the actual masses used when we generated the test signal. All the models recover the true values expect for the model TaylorF2 @2PN (in yellow) for which the recovered masses are biased.
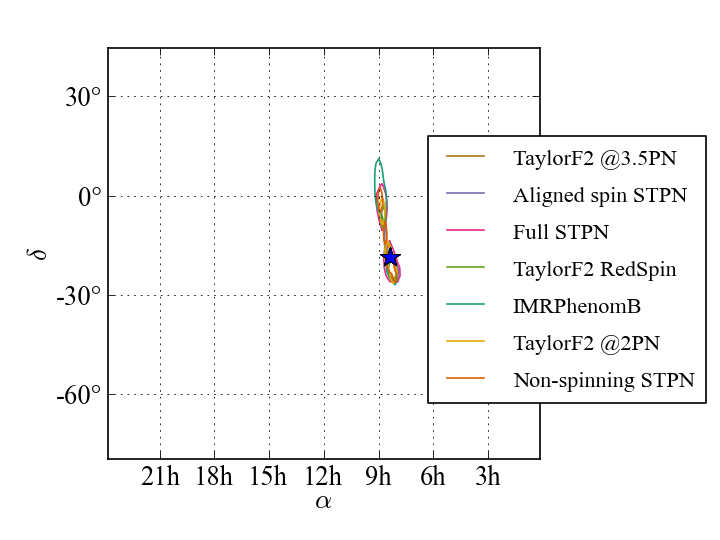
This plot shows the most probable values of the binary system’s sky location: for each model there is a 90% chance of the true sky location lying inside the respective contour line. The blue star marks the actual sky location used when we generated the test signal, and all the models recover the true values.
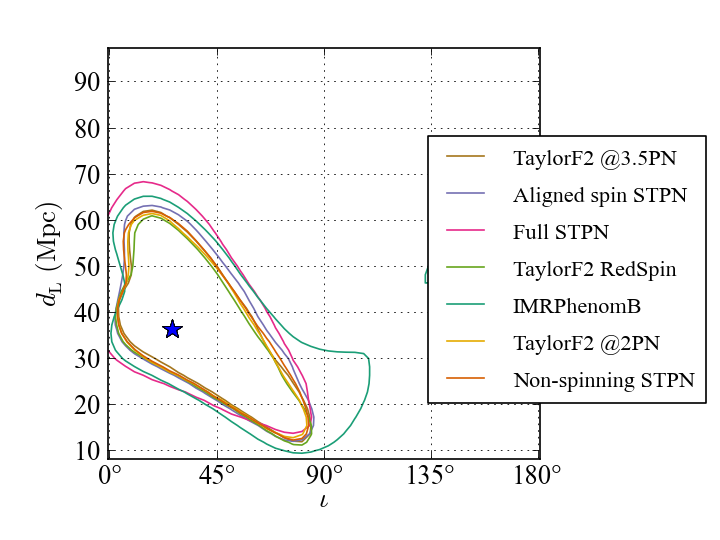
Here we try to recover the inclination of the test system (i.e. the angle between its orbital plane and the direction to Earth) and its distance from Earth using the different models. For each model there is a 90% chance of the true distance and inclination lying inside the respective contour line. The blue star marks the actual distance and inclination used when we generated the test signal, and all the models recover the true values.
The results of these analyses showed that we are able to recover the physical parameters of the sources, such as their component masses, spins and sky locations. However, we showed examples where the recovered masses and spins can be biased if we make incorrect assumptions when generating the template signals. Now that we know more about how important different aspects of the physics of the binaries will be in determining the signals, we are more ready than ever to open this new window on the Universe!