The inspirals of neutron stars with either another neutron star or a black hole are among the most energetic astronomical events in the universe. As such, they are the most promising candidates for producing both gravitational wave signals visible to the LIGO and Virgo detectors as well as a variety of electromagnetic signals ranging from gamma rays to optical signals to radio waves, visible with gamma ray, optical and radio telescopes, respectively. Each type of emission gives researchers different types of information about the system. Typical observations with a telescope yield information about things like the location of the event in the sky and possibly the galaxy, if any, the event took place in. Gravitational wave observations, on the other hand, do a poor job of determining the location of the event on the sky, but have the potential to produce information about the central engine driving the inspiral, such as the masses of the bodies in the binary, their spins as well as a distance measurement. Having observations of both electromagnetic and gravitational wave emission from the same objects or events will provide us with complementary information that will help us more completely understand the detailed dynamics of these systems.

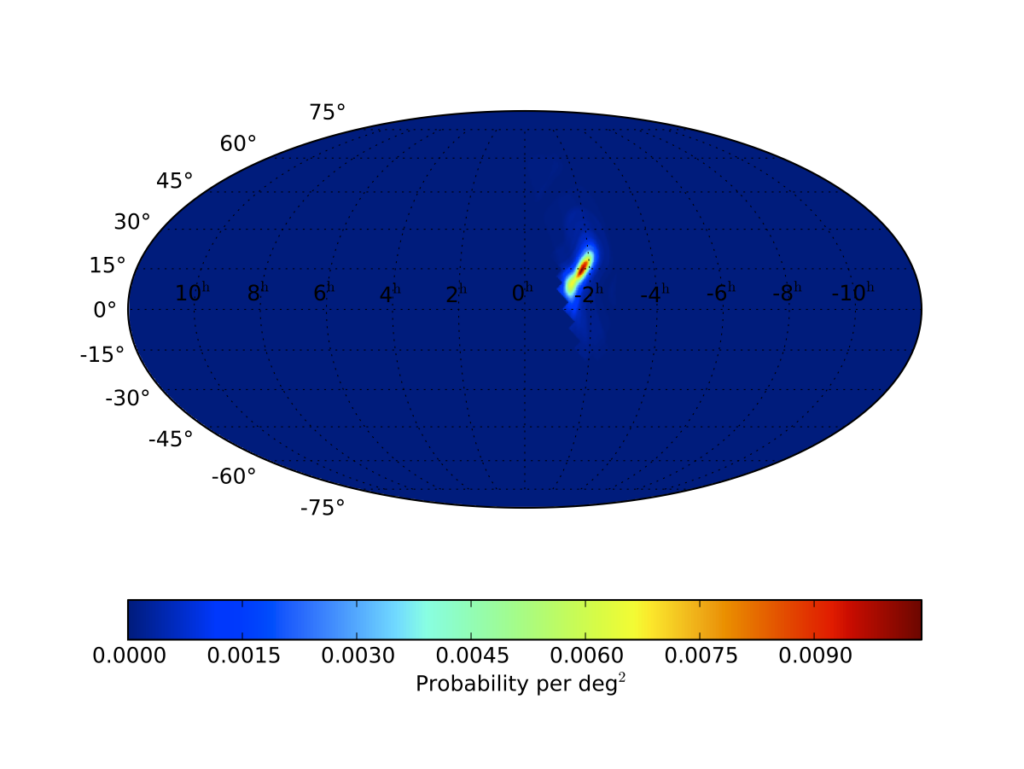
Gravitational wave skymap showing the likely location of an event, probably an instrumental artifact, on the sky. The event was imaged by several astronomical observatories. More probable regions of the sky are colored red while less probable regions are colored blue. Image taken from the publication.
There is great contrast between the types of instruments used to detect gravitational wave and electromagnetic emission. Gravitational wave detectors are all-sky monitors that get their localization ability from combining the data from multiple, geographically separated detectors. Most astronomical telescopes are pointed at much smaller regions of the sky. Because of this contrast, the search for both gravitational wave and electromagnetic emission typically happens in one of two ways. The first is to use information from astronomical observations, e.g. the time and location of an event, to perform a more sensitive search for gravitational waves by only analyzing data around the time of the event. The LIGO and Virgo collaborations have been performing such searches, triggered by the observation of an astronomical event, for years and they have been the source of the collaborations’ most astrophysically interesting publications. The other approach to searching for joint gravitational and electromagnetic emission is to use information from gravitational wave detectors to guide telescopes to interesting locations in the sky in hopes of catching the event as it happens. Electromagnetic emission is predicted on timescales ranging from a fraction of a second all the way up to months after the event. Catching the earliest emission is dependent on having the gravitational wave data analysis completed quickly, i.e. in low latency. The first search of this type for binary inspirals is the subject of the publication. Typical latencies of just under 4 minutes were achieved, while the timescale for astronomical observatories to be notified ranged from about 20–40 minutes.

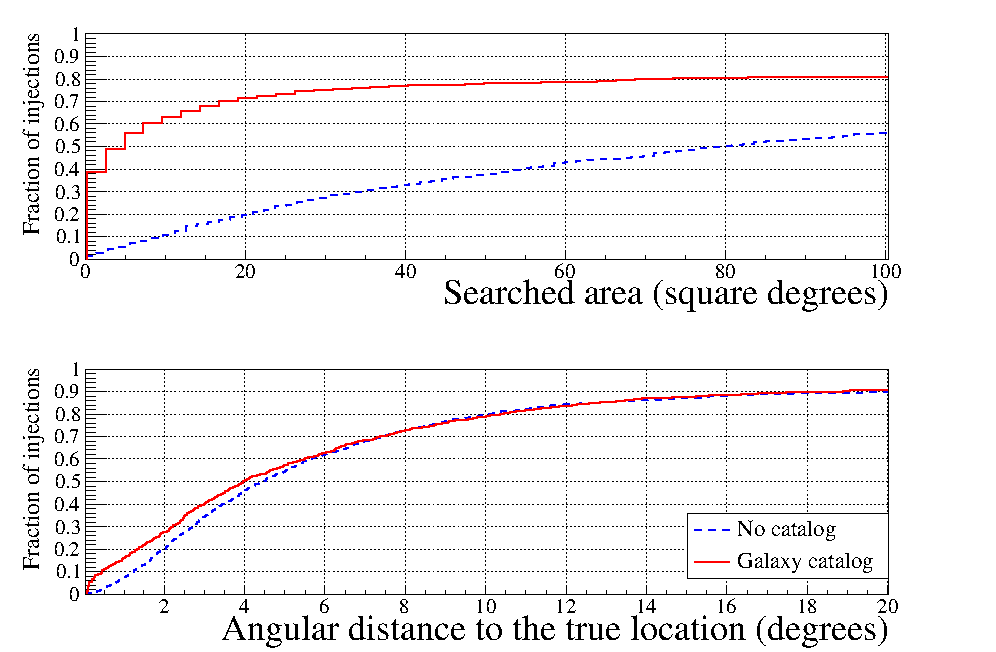
Sky localization performance. A set of simulated gravitational wave signals were injected into real detector data and run through the sky localization routine. Their locations in the sky were taken from a catalog of galaxies in the nearby universe. Two quantities are used to characterize the sky localization performance. The first is the smallest area on the sky, in square degrees, one would have to search to ensure the true location of the source is found. This quantity is known as Searched Area. The other is the angular distance between the actual source location and the most likely point identified by the sky localization routine. The top panel shows the fraction of simulated signals recovered with a given Searched Area. The bottom panel shows the fraction of simulated signals recovered with a given angular distance. In both plots the blue lines show the standard performance while the red lines show the performance assuming the signals originate from nearby galaxies.
In the end no event met the requirement for a detection based solely on gravitational wave data. However, a single alert resulted in several astronomical observatories taking images. Though the event was likely an instrumental artifact, we look forward to the results of the image analysis.

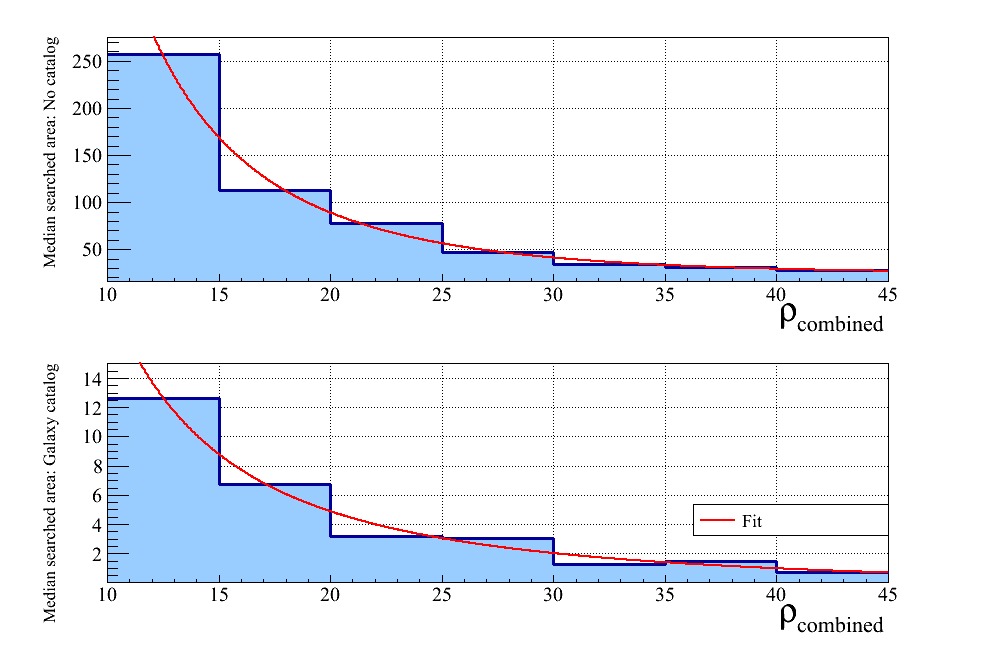
Another characterization of sky localization performance. This plot is based on the same simulated gravitational wave signals as the plot above. The horizontal axis is a quantity that measures the loudness with which the gravitational wave signals were recovered, known as combined signal-to-noise ratio. The vertical axis shows the median Searched Area for signals in the corresponding range of combined signal-to-noise ratio. The top panel depicts the results without the use of a galaxy catalog, while the bottom panel shows results after using the galaxy catalog to help identify the location of the source. Note that in both plots the Searched Area decreases as the combined signal-to-noise ratio increases, i.e. the sky localization is better for louder signals, just as one would expect.

