On August 26, 2025, the LIGO-Virgo-KAGRA Collaboration released the first set of results from their fourth observing run (O4a). This fourth Gravitational-Wave Transient Catalog (GWTC-4.0) represents a cumulative collection of all gravitational-wave signals observed by the LVK to date. It includes 128 new significant signals from compact binary coalescences. This brings the number of detections to 218, more than doubling the size of the catalog. Additional information can be found in the publications, companion papers, science summaries, and other resources below.
![GWTC-4.0 mass-mass plot. Each dot represents the pair of masses associated with a gravitational-wave event in the GWTC-4.0 catalog. Masses are in units of solar masses, with the primary (more massive) member of the binary listed on the x-axis and the secondary (less massive) member on the y-axis. Blue dots denote events from O4a; gray are from earlier observing runs. Each dot represents the median mass and does not include error bars. The size of each dot corresponds to the network SNR (signal-to-noise ratio) with an arbitrary scaling. Dotted straight lines are lines of constant mass ratio q, with the top solid black line representing the equal mass limit. The dashed lines are curves of constant total mass. [G. Ashton/LVK]](https://ligo.org/wp-content/uploads/2025/08/GWTC-4p0-mass_mass-scaled.png)
Publications & Documentation
- Publication (introduction): GWTC-4.0: An Introduction to Version 4.0 of the Gravitational-Wave Transient Catalog (submitted for publication). [pdf download from LIGO DCC] [arXiv version].
- Publication (methods): GWTC-4.0: Methods for Identifying and Characterizing Gravitational-wave Transients (submitted for publication). [pdf download from LIGO DCC] [arXiv version].
- Publication (results): GWTC-4.0: Updating the Gravitational-Wave Transient Catalog with Observations from the First Part of the Fourth LIGO-Virgo-KAGRA Observing Run (submitted for publication) [pdf download from LIGO DCC] [arXiv version].
- News Release.
- Science Summary [pdf flyer].
- Companion Papers:
- Open Data from LIGO, Virgo, and KAGRA through the First Part of the Fourth Observing Run (submitted for publication). [pdf download from LIGO DCC] [arXiv version].
See also the associated science summary [pdf flyer]. - GWTC-4.0: Population Properties of Merging Compact Binaries (submitted for publication). [pdf download from LIGO DCC] [arXiv version].
See also the associated science summary [pdf flyer].
- Open Data from LIGO, Virgo, and KAGRA through the First Part of the Fourth Observing Run (submitted for publication). [pdf download from LIGO DCC] [arXiv version].
- Data release for O4A Catalog (Gravitational Wave Open Science Center/GWOSC).
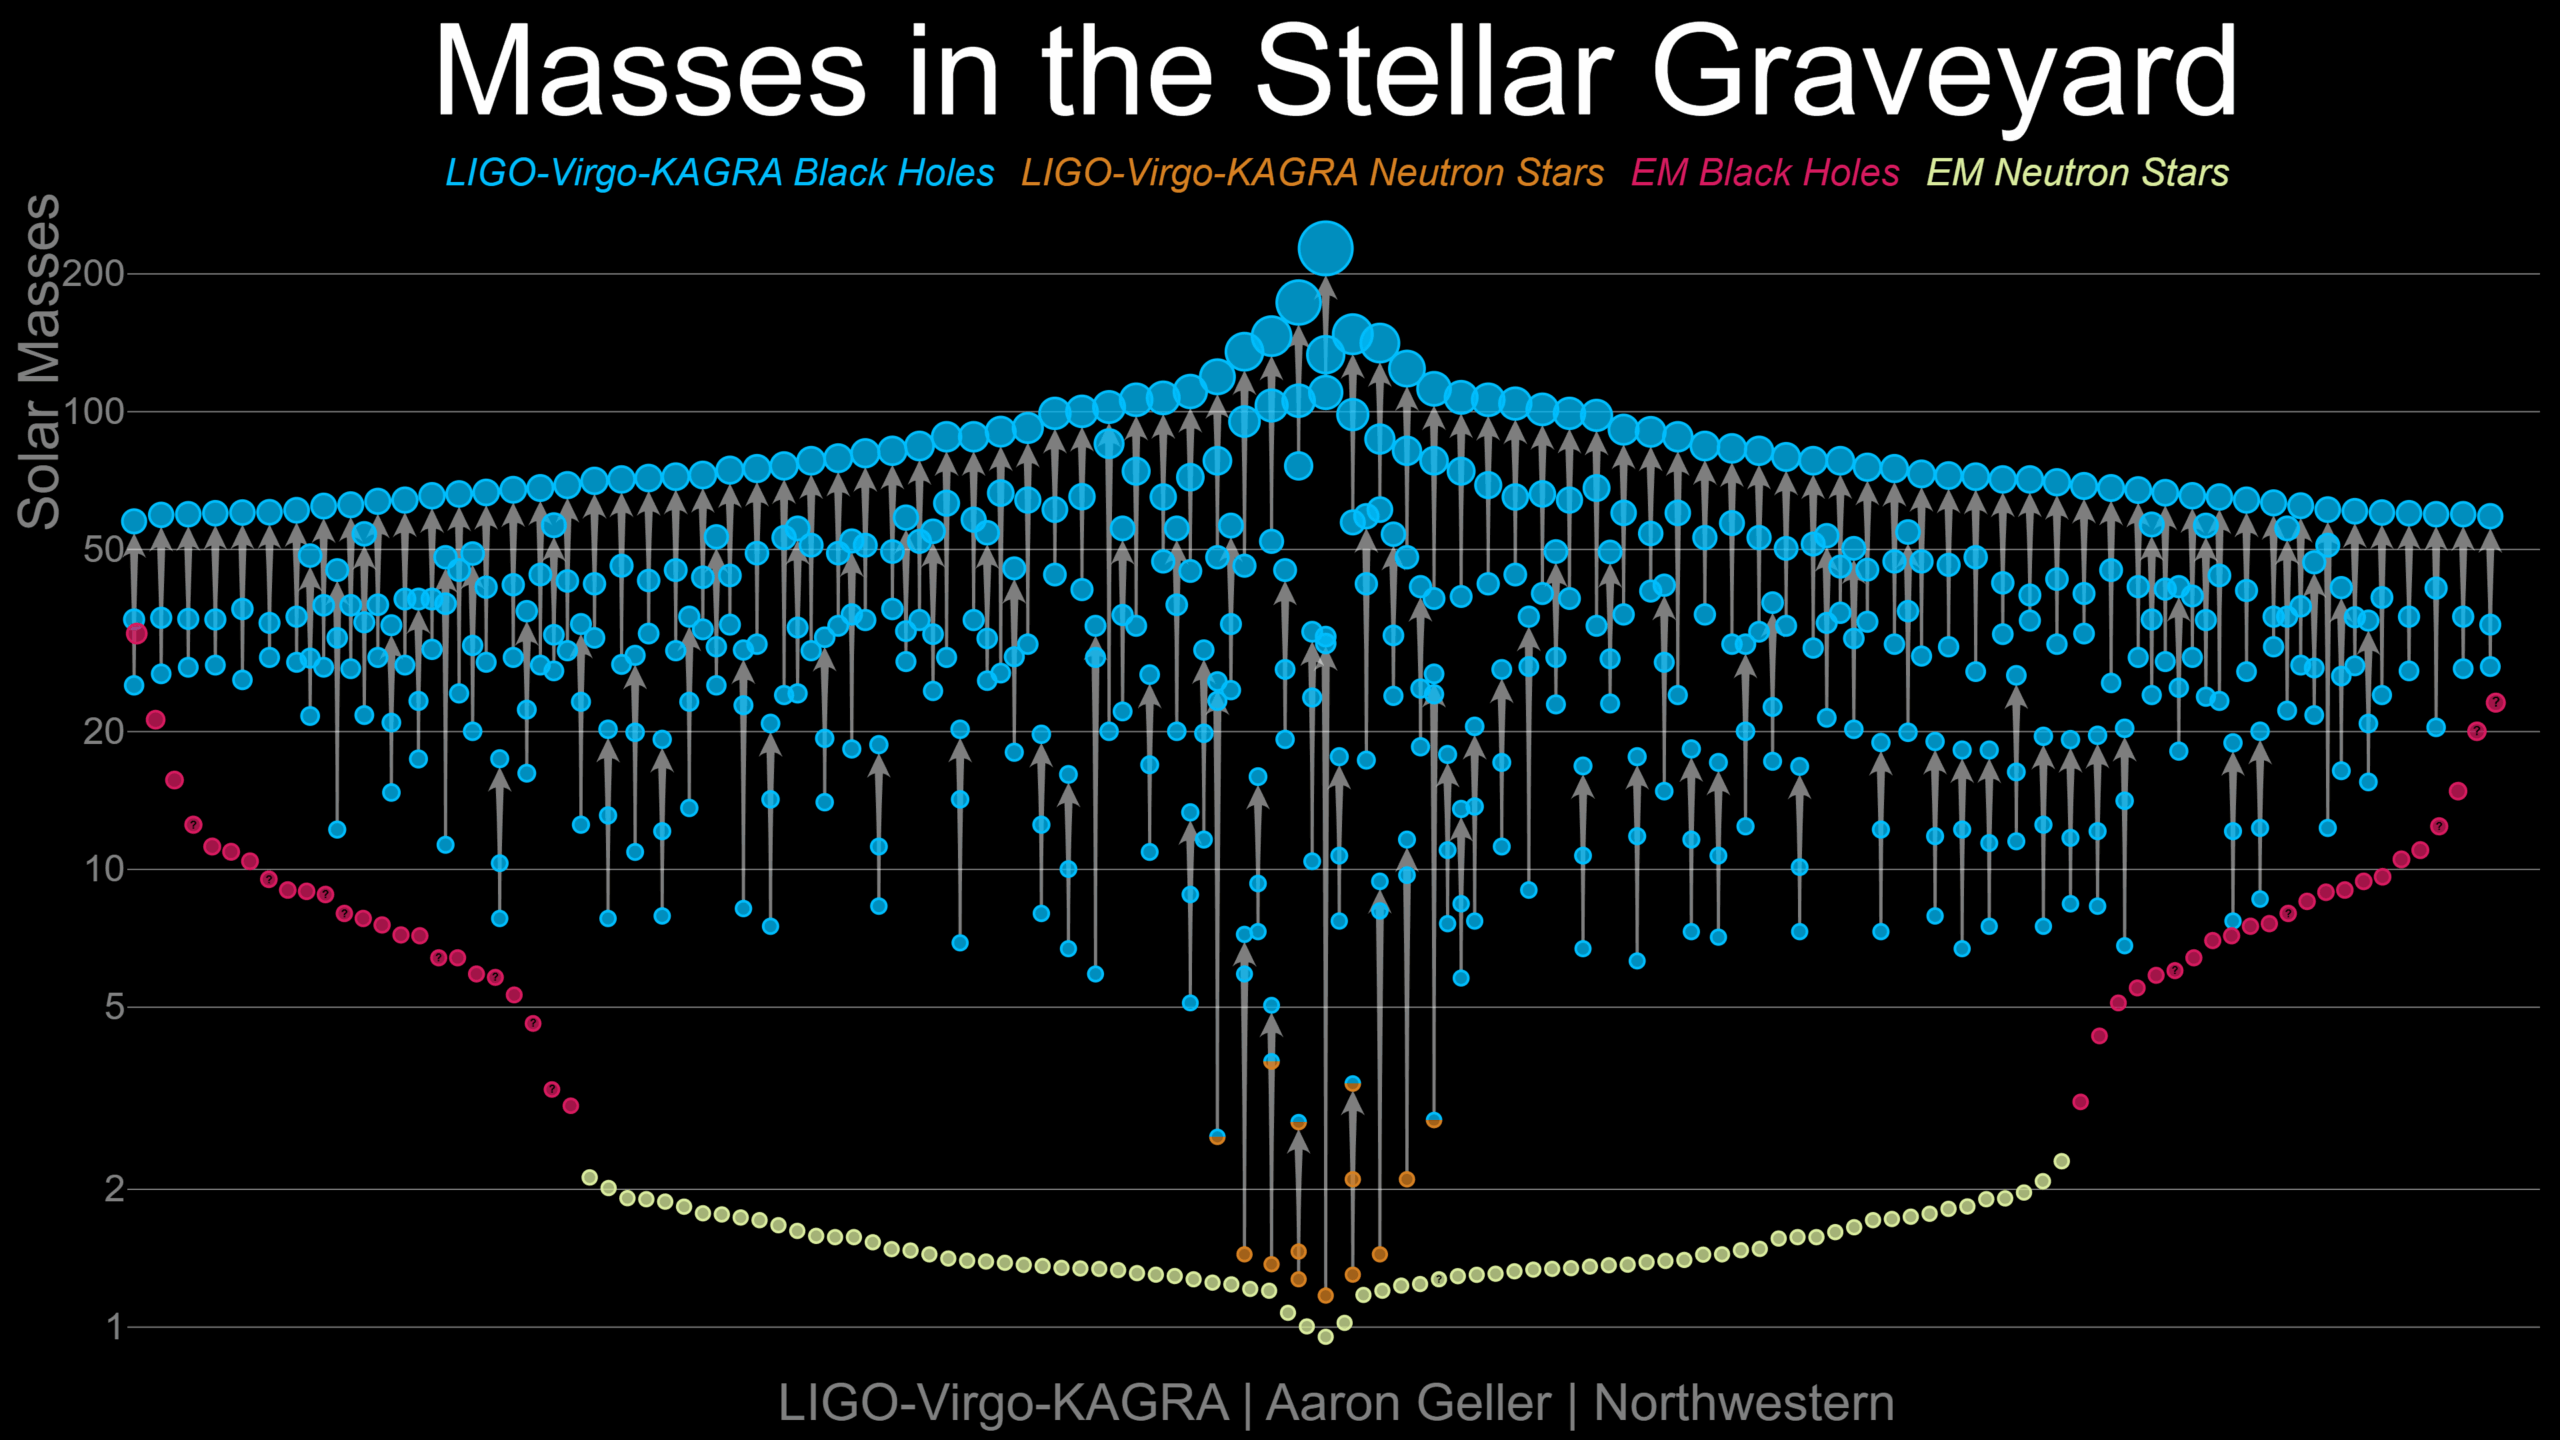
- Masses in the Stellar Graveyard (interactive plot)
- LIGO Compact Binary Interactive Catalogue.
- LIGO Compact Binary Interactive “Bubble” Plot.
- Interactive Gravitational Waveform Viewer.
- See the main ligo.org detection page for further resources.
Additional Images & Videos
![GWTC-4.0 "petri dish" plot. The disk is broken up into segments corresponding to the LVK observing runs O1, O2, O3, and O4a. Gravitational-wave events observed in each run are plotted as colored circles and arranged as a function of time from the start of each run, with time increasing as a clockwise angle from the vertical. The size of each circle is proportional to the binary's mass. Darker circles indicate higher SNR (signal-to-noise ratio), while distance from Earth is indicated by distance from the disk's center. [D. Davis, R. Udall/LVK]](https://ligo.org/wp-content/uploads/2025/08/GWTC_neighborhood_annotated-scaled.png)
Numerical relativity visualization of GWTC-4.0 events. This shows binary black hole merger simulations with parameters consistent with 86 new events from O4a. Each panel shows the tracks of the merging black holes at the center, surrounded by the emitted gravitational waves. The tracks of the black holes are shown in white, and the gravitational-wave emission is shown in purple to yellow. Dark purple represents comparatively weak gravitational waves; yellow represents the strongest waves emitted around the merger. A reference time is shown at the bottom, with each simulation scaled by a relative speed-up factor proportional to the total system mass. See the youtube video caption for more details. These simulations were provided by the Simulations of Extreme Spacetimes (SXS) waveform database. [I. Markin, T. Dietrich, & H. Pfeiffer/Potsdam U./Max Planck Inst. for Gravitational Physics]