The Advanced LIGO, Advanced Virgo and KAGRA detectors are sensitive to gravitational waves (GW) from all directions. They have observed signals from various compact object mergers, combinations of black holes and neutron stars. Merging binaries are visible in the GW detectors only for a few seconds while they emit their characteristic ‘chirp‘ signal. There are more sources of gravitational waves that are yet to be detected. One of them is the result of accumulation of unresolved short-duration sources and events of cosmological origin, which is indistinguishable from background noise in a single detector. This persistent background signal, which is expected to be detected in the coming years, is known as the stochastic gravitational wave background.
Since this background is stochastic (random) it cannot be detected with matched filtering like a signal with predictable shape. Therefore, a cross-correlation technique is used. The idea here is that the terrestrial noise in each detector will be different but a signal coming from a particular direction in the sky, even if random, would appear the same in all the detectors. To get the cross-correlation, the data streams from a pair of detectors (a baseline) are multiplied together and summed. A ‘peak’ in this cross-correlation indicates the interferometers detected the same thing. Also since the detectors are at different locations on the Earth the signal arrives at them at slightly different times due to signal travel time, an effect which can be used to identify the direction the signal came from. Combining such time-of-arrival ideas to locate a source in the sky with the effect of earth’s rotation we can make a full skymap from the cross-correlated results (a technique called aperture synthesis).
Various searches have already been performed to detect and map the stochastic gravitational wave background using the aforementioned techniques. These searches are optimised for certain expected properties of the stochastic gravitational wave background so they can find such sources more easily and with less computational cost. But such searches are sometimes computational resource limited (e.g. some searches can take upto 300 GB memory and 800 TB intermediate storage). The present paper reports the result of a new search which looks for persistent stochastic GW sources in all directions of the sky in all frequencies at which the detectors are sensitive. We call this the all sky all frequency radiometer search. This search has become possible after the implementation of data-folding techniques and additional computational optimisations developed by the collaboration members resulting in the new search algorithm PyStoch.
For this all sky all frequency search we used the data from the first three observational runs of the Advanced LIGO and Advanced Virgo detectors. We divided the sky into 3072 regions (pixels) of equal area and searched from 20Hz to 1726Hz with a spacing of 1/32Hz for a persistent GW source in every pixel. Unfortunately, some frequencies are contaminated with unavoidable disturbances (e.g. calibration lines, power lines, and their harmonics etc.). These are excluded from our search. We calculated the signal to noise ratio (SNR) in all the pixels for all the frequencies.
If the SNR is large in a certain bin, then this could indicate a detection. However, to decide whether a certain SNR value is indeed exciting, we need to determine the noise background. Since it is impossible to directly measure the detector noise in the absence of GW signals, the background is estimated by introducing a random unphysical time-shift between the data streams from a pair of detectors which is much greater than the light travel time between their locations. This ensures that the correlation (if observed) must be noise and not an astrophysical signal. This noise background allows us to evaluate if the observed outliers are statistically significant. Figure 1 summarizes the SNR values we have obtained in this way. The purple line shows the time-shifted data, which indicates how large SNRs are expected when no signal is present. The blue bars represent our actual scientific analysis. As you can see from the figure, the blue curve is nearly perfectly on top of the pink curve. This indicates that no persistent GW signal was detected by our analysis in the first three observing runs from the Advanced LIGO and Advanced Virgo detectors.
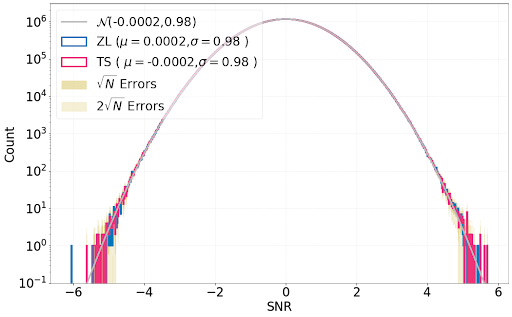
Figure 1: SNR distribution across all frequency bins and sky-directions. The blue histogram represents our actual measurement, whereas the red histogram arises from the unphysical time-shifted analysis. Both the physical and unphysical time-shifted data set are consistent with correlated Gaussian noise (grey curve). Therefore, our new search has unfortunately not yielded any astrophysical signals.
We nevertheless searched for SNR outliers in all the frequency bins. We took the SNR from the pixel with maximum SNR in each frequency bin and plotted them in Figure 2 for both background and foreground in red and blue points. We estimated a threshold for detection (1% false-alarm probability) given in yellow. The 515 foreground points above this threshold are colored teal. These points can be potential detection candidates, but in this study the threshold is very low and when there are so many random points, some are bound to be above a relaxed threshold. These ‘insignificant candidates’ are not too high above the threshold and below a 5% false-alarm probability threshold when considering the full sensitivity range of the detector. Although we did not find any significant sources this way, we are confident in our method because we were able to recover the majority of a set of simulated signals that were added to our data.
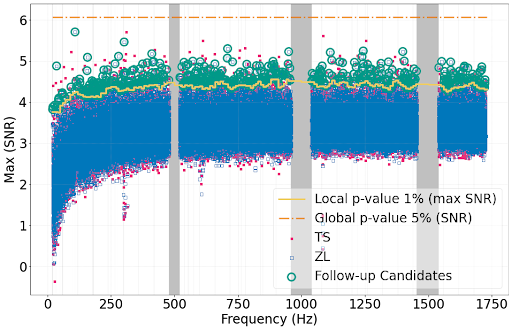
Figure 2: This plot depicts the distribution of maximum SNRs from both background and foreground analyses performed over the combined baselines and all three observing runs. The yellow curve shows the threshold which contains 99% of the noise background, smoothed over 3 neighboring 10 Hz bins. Though we do not find any outliers significantly above the noise background, the teal circles represent 515 candidates which may be followed up by a more sensitive matched-filtering-based analysis. The grey solid lines represent the frequencies that are excluded.
Note that while matched filtering based analyses can search for isolated neutron stars at narrower frequency bins and are more sensitive, our all sky all frequency analysis can rapidly search for such monochromatic signals with very little computation power and set upper limits at all frequencies and sky-locations at the resolutions used here. A point in this context is that the 515 insignificant candidates mentioned previously should be followed up by other search methods. Another advantage of the all sky all frequency search is that the results of some other searches (e.g. broadband radiometer, isotropic) can be derived from all sky all frequency results. We have confirmed this for the isotropic search where it is assumed that the signal is the same in all directions. We performed the analysis using data from the Hanford-Livingston detector pair and averaged over all directions to get the isotropic results.
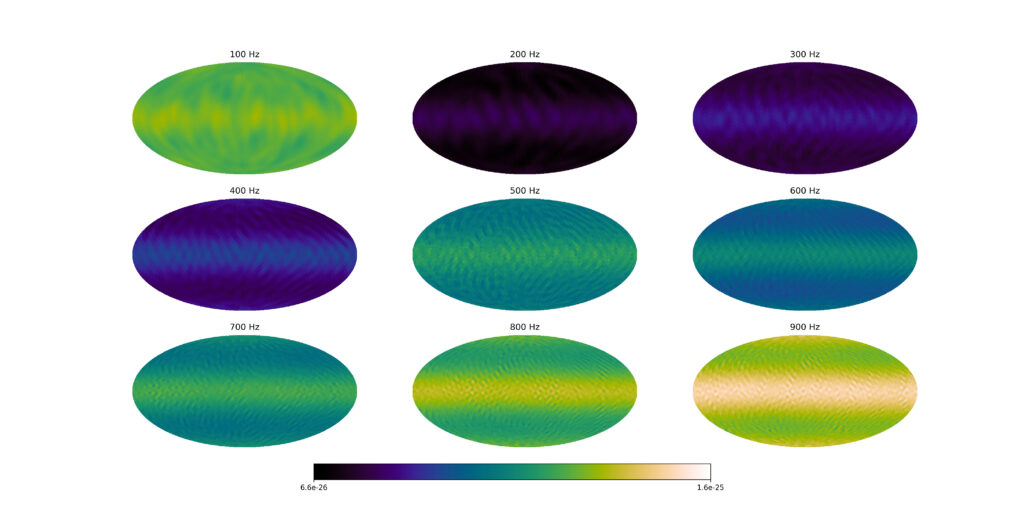
Figure 3: (click the image for a high-resolution version) These maps show the upper limits of expected gravitational waves strains at different frequencies. The upper limit means the extraterrestrial signal at these frequencies cannot be more than what is shown in these maps. The color-shading indicates the sensitivity of our search in different frequency bands, and for different sky directions. One can see that the search is generally somewhat less sensitive near the equatorial plane. Moreover, the search is most sensitive in the 200-400Hz range.
While, unfortunately, we have not found a signal in the data collected so far, we are looking forward to applying our new search capabilities to future data that the LIGO/Virgo/KAGRA detectors are going to collect at higher sensitivity starting next year in the fourth observing run.
Find Out More:
- Visit our websites:
- Read a free preprint of the full scientific article here or on arXiv.org.