To date, many gravitational waves (GWs) have been observed by the LIGO and Virgo detectors. (See here for the latest catalog of events.) However, the fainter a GW is, the more difficult it is to identify. Being able to find these fainter waves is a key part of our efforts to make new scientific discoveries. One way we can do this is to use information from the electromagnetic spectrum to give us a hint that a weak GW might be hiding in our data. This work used gamma-ray bursts (GRBs) to do exactly that.
Gamma-ray bursts
GRBs are immense explosions that can give off as much energy in gamma rays over a few seconds as our Sun will emit across the electromagnetic spectrum in its 10 billion year lifetime. This means gamma-ray telescopes can detect them from billions of light years away, and on average approximately one GRB is seen every day. We pay close attention to the notices that gamma-ray astronomers send out announcing every GRB they detect, since knowing when and where in the sky a GRB happened allows us to focus our efforts, potentially enabling us to find associated GW signals that we might otherwise miss.
Around one third of GRBs last less than a few seconds (short GRBs). These are caused by the collision of two neutron stars, like in the case of GW170817 and GRB 170817A, or perhaps by a neutron star being torn apart as it falls into a black hole. These cataclysmic events are the climax of a gradual inward spiralling of the two objects, a process that gives off GWs with shapes we can predict, called chirps. Because of this we have written software dedicated to finding these GW chirps coming from short GRB events.
The remaining two thirds of GRBs last between a few seconds and a few minutes. These long GRBs are caused by massive stars dying in great explosions, where their cores implode under their own gravity to form black holes, releasing a huge quantity of energy in the process. This kind of event can produce bursts of GWs with shapes that are hard to predict. We have written software to hunt for such bursts despite not knowing exactly what they might look like. Because we make no assumption about the signal shapes, we can use this burst analysis to look for GWs from both long and short GRBs.
What did we find?
Between 1 November 2019 and 27 March 2020, there were 108 GRBs observed by the Swift and Fermi gamma ray satellites. 86 of these happened when our GW observatories were turned on and taking science data suitable for our analyses, and of this sample 17 were short GRBs. Unfortunately, neither of our analysis methods found any GWs associated with the GRBs we targeted. Since most GRBs happen very far away this is not unexpected.
In both of our analyses, we look at a limited chunk of GW data spanning the time of each GRB to search for a signal. For the chirp analysis this is 6 seconds long, whereas the burst analysis uses a much longer chunk of at least 660 seconds. In both cases we first identify the most promising GW candidate in the chunk, and then compare with other chunks of data at other times where we don’t expect a signal to be (because no GRB or other electromagnetic source was observed). This allows us to estimate how likely it is that our selected candidate is just caused by normal noise fluctuations in the data. We call this the p-value. The larger the p-value, the more the candidate resembles the background noise. Conversely, smaller p-values can indicate a more promising candidate GW. Unfortunately, none of the candidates found by our GRB analyses had extremely small p-values. Taken together, they were as expected if all we found were random noise fluctuations. This means we don’t believe we detected any new GWs.
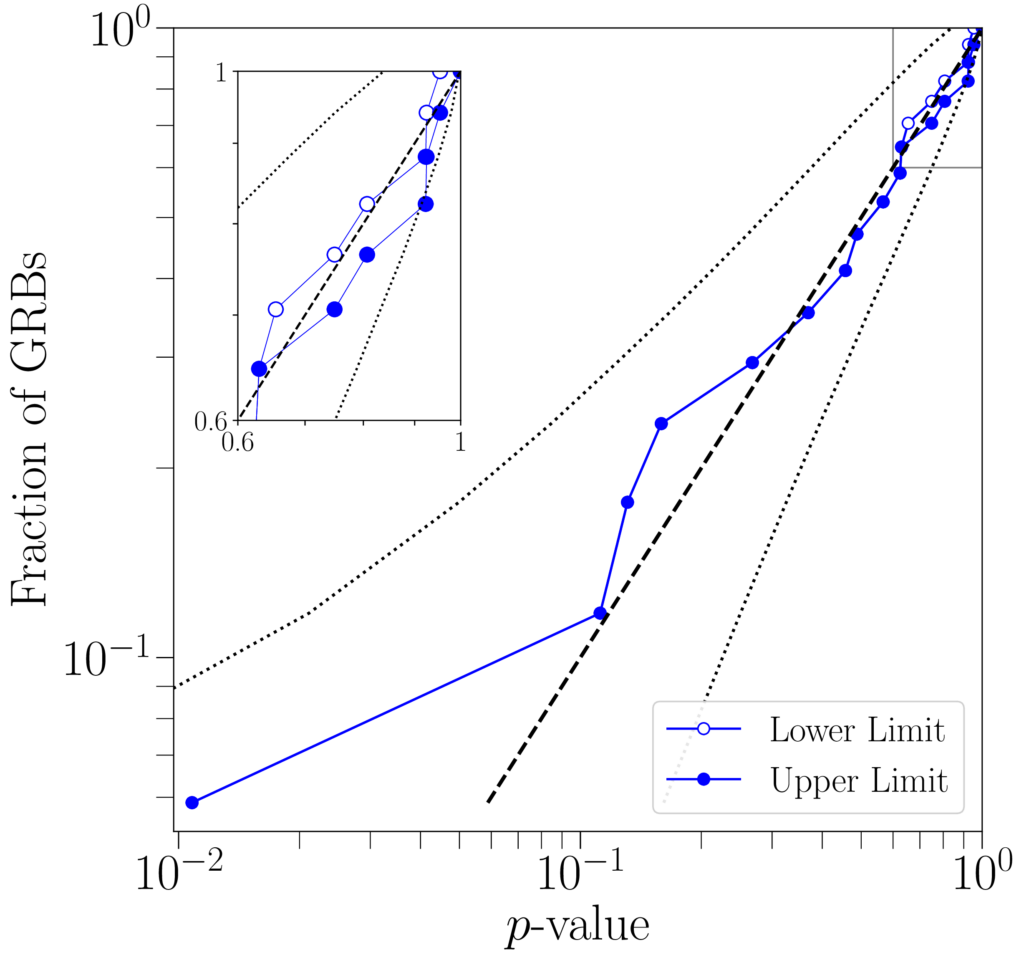
Figure 1: The p-values of the best candidate found for each of the 17 short GRBs analysed with our chirp analysis, arranged from smallest to largest (blue points). Smaller p-values represent candidates that stand out more from the background noise, so might be more likely to indicate a GW signal. However, if all the candidates were caused by random noise we would still expect some to have small p-values just by chance. In that case we would expect them to lie approximately along the black dashed line on this plot, with only a 10% likelihood of landing outside of the black dotted lines. Since the blue points are all within these dotted lines, we can conclude that there is nothing surprising about the p-values we obtained that cannot be explained by random chance.
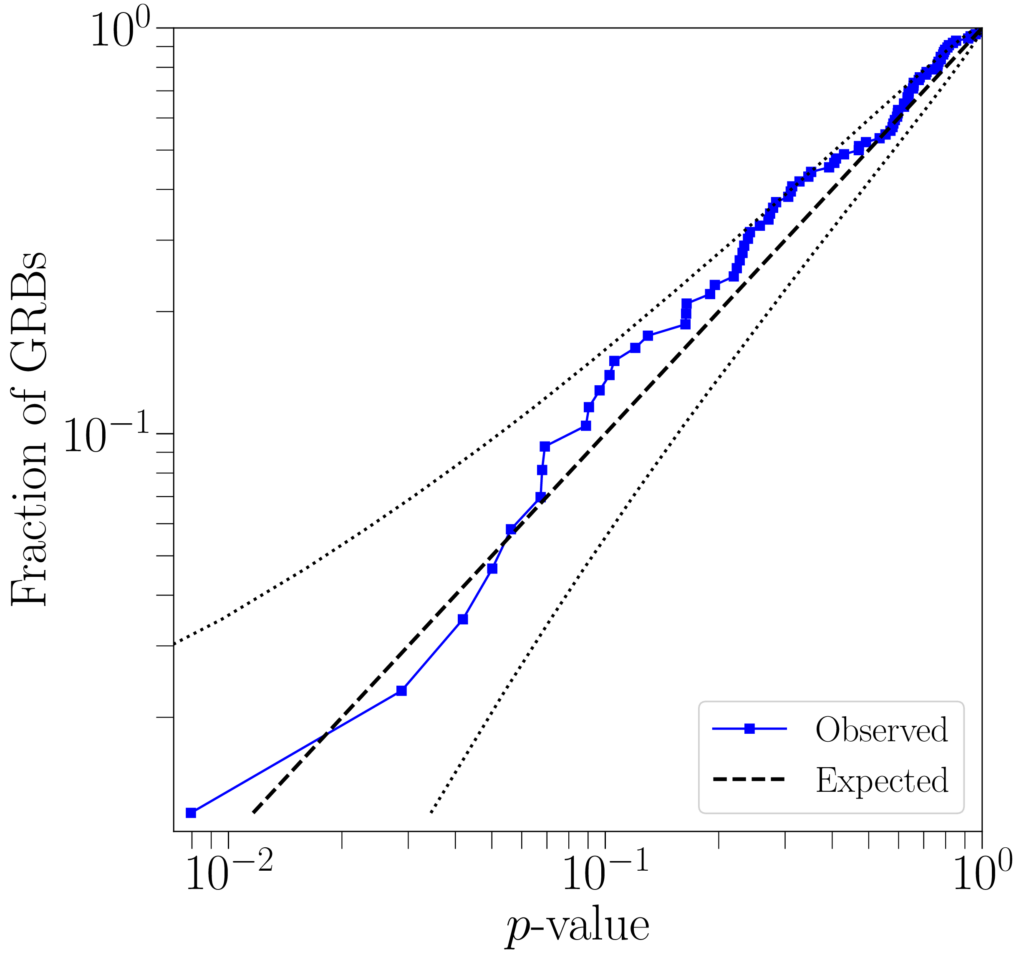
Figure 2: The p-values of the best candidate found for each of the 86 GRBs analysed with our burst analysis, arranged from smallest to largest (blue points). Just like in Figure 1, the p-values lie approximately along the black dashed line on this plot and within the black dotted lines, so again we conclude that they can be explained by random chance.
Since we found no GWs we can ask the question: how far away would each GRB need to be for us to have been unable to detect any GWs it might have produced (the strength of a GW falls off proportionally with the distance from its source). We can estimate this “exclusion distance” by artificially inserting fake signals into our data at different distances and seeing up to what distance we can reliably find them. If we do this for sets of different types of fake signal we can estimate different exclusion distances for each type, since our analyses can have different levels of sensitivity to different types of signals.
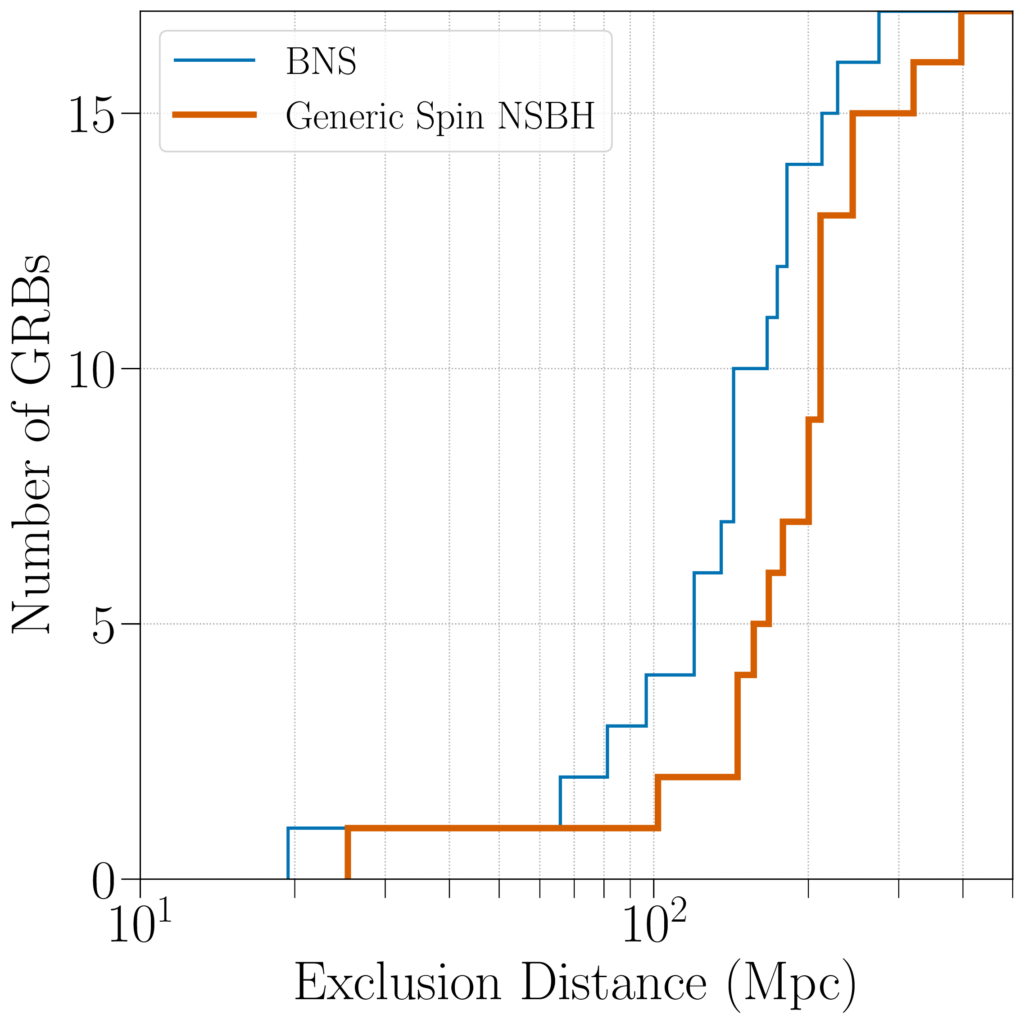
Figure 3: Exclusion distances from our chirp analysis method for two different types of GW signal model. An exclusion distance is an estimate of how far away a GRB would need to be if it was caused by a certain type of astronomical event, given that we did not detect any GWs. Our GW detectors are not equally sensitive in all directions, and different GRBs happened when different combinations of our detectors were operating, meaning the combined sensitivity could vary significantly from one GRB to the next, resulting in a range of exclusion distances. The thin blue line shows that for binary neutron stars our exclusion distances range from about 20 megaparsecs (Mpc) to almost 300 Mpc, with a median at 149 Mpc. Neutron star-black hole binaries will be more massive than binary neutron stars so can give off stronger GW signals, therefore would have to be further away to remain undetectable (bold orange line; median 207 Mpc).
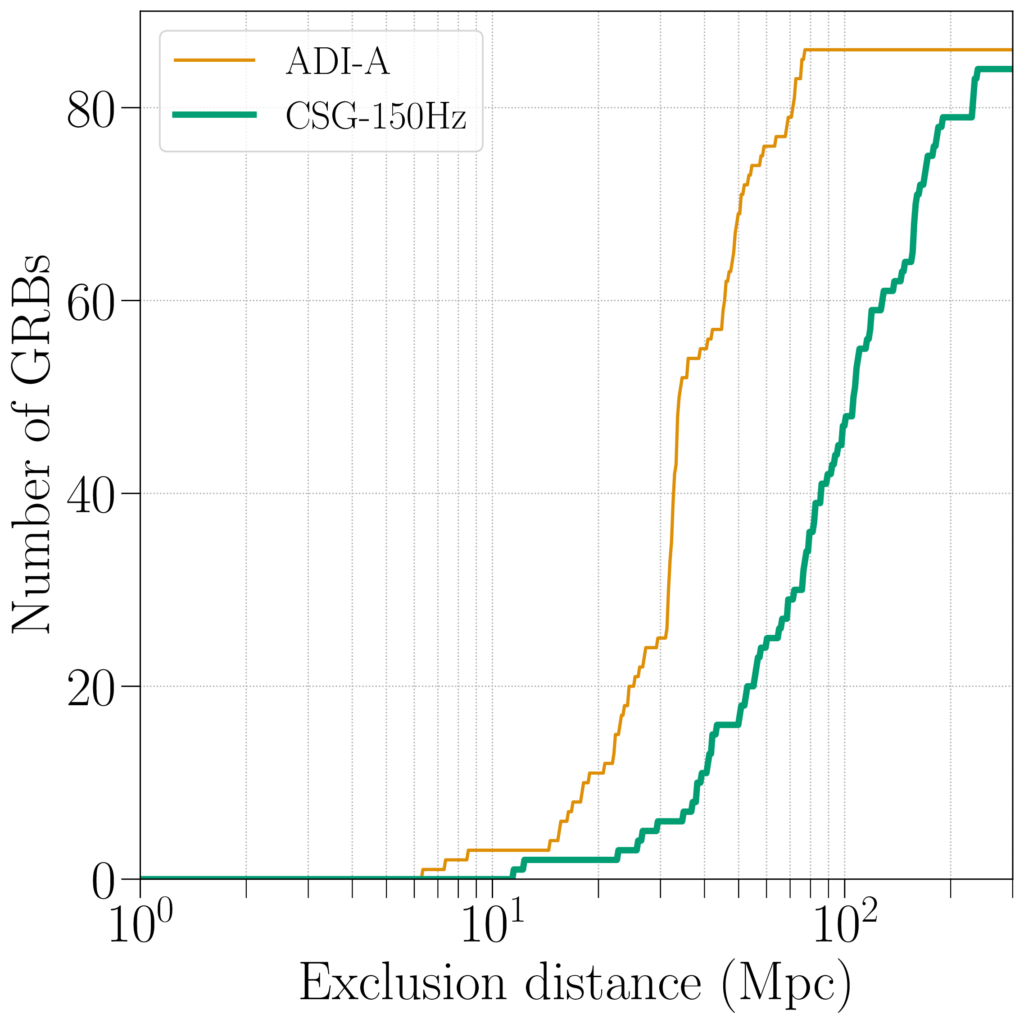
Figure 4: Exclusion distances from our burst analysis method. As in Figure 3, we show the distances for two different GW signal models. In this case they are an accretion disk instability model (ADI; thin orange line) and a circular sine-Gaussian model (CSG; thick green line). An accretion disk is a disk of material that swirls around a black hole, eventually falling into it. If magnetic fields cause the disk to be uneven, or lumpy, then as it rotates around the black hole it can produce GWs. A CSG is a simple model representing the GW emission from a collapsing star. The median exclusion distances for the ADI and CSG models were 34 Mpc and 92 Mpc.
Does non-detection tell us anything about short GRBs?
Short GRBs are still a poorly understood class of astronomical events. For example, they appear to vary a great deal in their luminosity and we know very little about how common the faintest short GRBs are or just how faint they can get; most GRBs that look faint could simply be farther away. We can use our chirp analysis results to understand this better by combining our findings from this work with previous work in the first, second, and early third observing runs of LIGO-Virgo.
The fainter a short GRB is, the closer it will need to be for our telescopes to detect it. The closer it is, the more likely it becomes that we might also detect any GWs that were emitted. Therefore, the more inherently faint short GRBs there are, the more often an observed GRB will have a GW signal associated with it. Based on how many GRBs we have analyzed, and that, except GW170817, no GWs have been identified coming from them, we can narrow down what fraction of GRBs are very faint and therefore estimate the total rate of short GRBs – of any luminosity – in the local universe. We find that this rate is consistent with the rate of binary neutron star mergers we infer from GW detections, and predict that the fourth observing run could feature approximately one joint GW+GRB detection per year.
Find out more
- Visit our websites:
- Read a free preprint of the full scientific article here or on arXiv.org