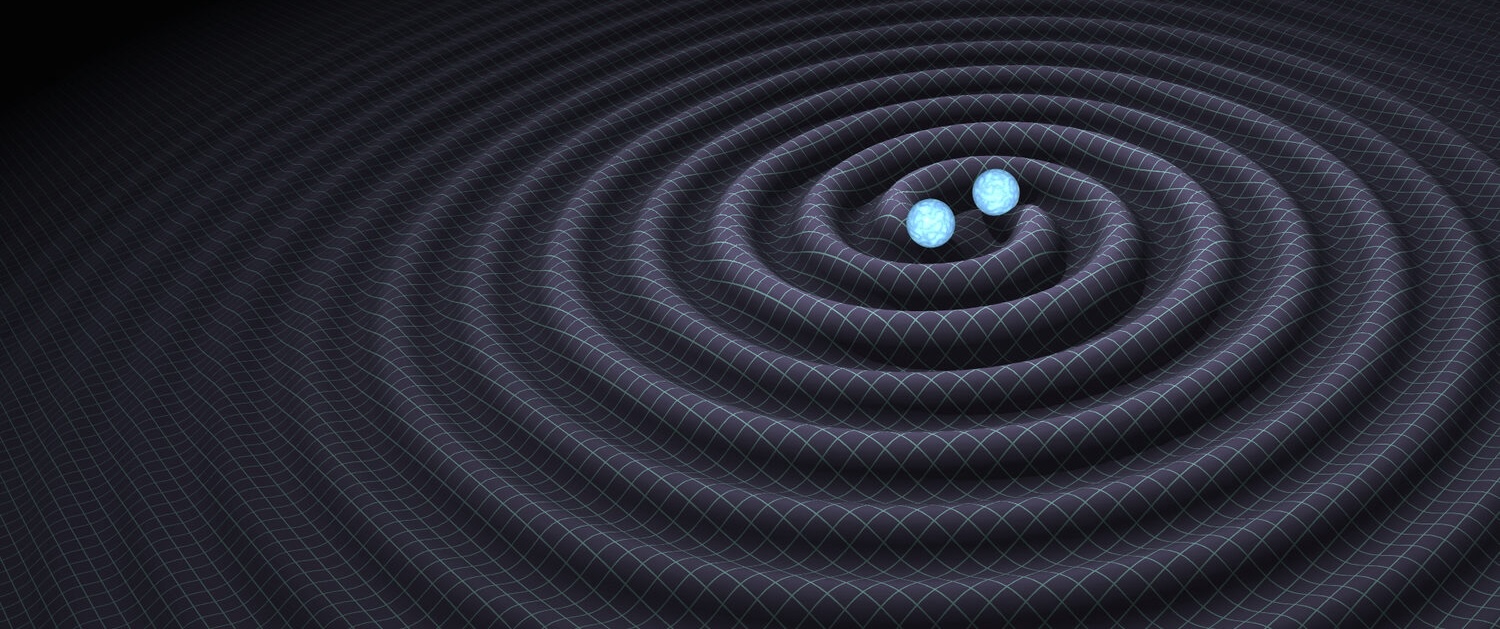
On September 14, 2015, the LIGO and Virgo Scientific Collaborations detected for the first time gravitational waves from a pair of colliding black holes using the Advanced LIGO (aLIGO) detectors. The observation of this cataclysmic event, named GW150914, marked the beginning of an entirely new way to look at and learn about our Universe. To read more about the discovery and its initial interpretation, visit the associated Science Summary Pages. Here we revisit our initial analysis of the properties of GW150914 and examine the accuracy of the models for the gravitational waves we used to determine the nature of the source.
What made the gravitational waves of GW150914?
These gravitational waves were emitted from the merger of two rotating black holes, each around 30 times the mass of the Sun. Such heavy stellar mass black holes form when a large star can no longer support its gravitational pull and collapses under its own weight to a black hole. The black holes were estimated to be about one billion light years away.
Just as the Earth rotates about its axis as it goes around the Sun, the two black holes will rotate as they orbit one another. And, just as the Earth’s axis of rotation is tilted relative to the plane of its orbit around the Sun, the rotation axes of the black holes may be tilted as well. We measure the spin of black holes relative to their maximum allowed value. A black hole that has a spin magnitude of 1 would be spinning as fast as allowed by the laws of Einstein’s General Theory of Relativity. Similarly, a spin value of 0.2 means the black hole is spinning with only 20% of the maximum value. The directions of the black holes’ spins relative to the plane in which they orbit can lead to interesting effects in the motion and emitted gravitational waves. The orbit of the binary can precess like a wobbling spinning top. which in turn causes the emitted gravitational waves to be modulated. You can read more about black hole spin here.
We also measured the angle at which we see the black hole binary. This angle could be a right angle, so that we are looking straight at the orbital plane; in this case the orbit would appear to us as a circle or an ellipse. Or we could happen to see the orbital plane “edge on”, from its side, in which case the orbit would appear to us as a straight line. Thirdly, the viewing angle could be somewhere in between these two extreme cases.
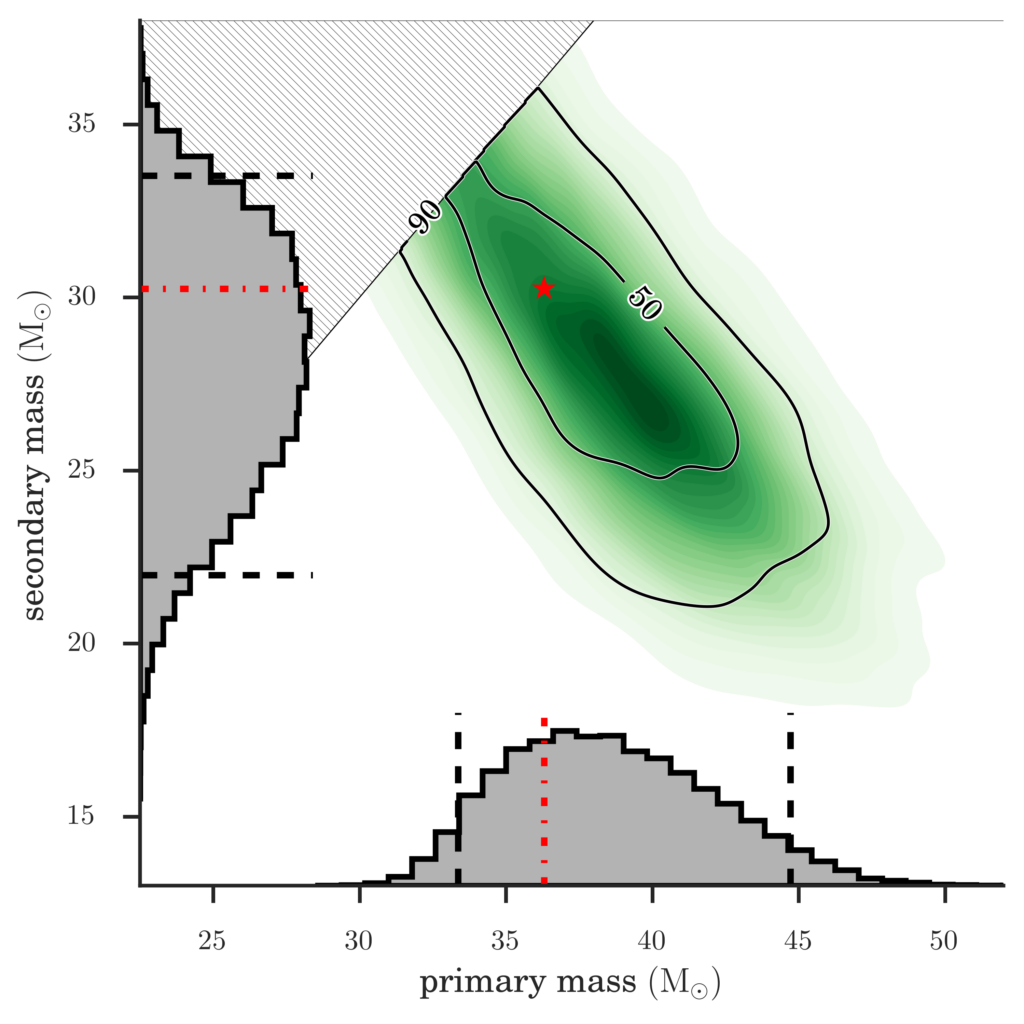
Figure 1: This image shows which black hole masses, in units of the mass of the Sun, are consistent with the numerical relativity mock signal. The contour map in the upper right part of the figure shows which combinations of black hole masses are consistent, for the two black holes (denoted ‘primary’ and ‘secondary’) considered together. Regions where the contour map is darker show mass combinations that have higher probability of being correct. The grey ‘hills’ (known as histograms) show the relative probability of different masses being correct for each black hole considered separately. We measure a 90% probability that the mock signal was produced by black holes with masses inside the outer black contour labeled “90%”. The true values of the masses are indicated by a red asterisk in the contour plot and red lines in the histograms.
How do we know that?
Binary black holes are characterized by a set of parameters, which influence how the gravitational-wave signal looks like when it arrives on Earth. While some of the parameters that might describe you are your weight, your height and your home address, for black holes it is their masses, their spins, location and orientation. Once a gravitational-wave signal is identified in the data (for more details see here and here), supercomputers around the world start buzzing to determine what created the signal that we detected. To do so, the supercomputers try millions of combinations of tentative black hole masses, rotation rates, and locations of the merging black holes. For each one of these millions of combinations of parameters, the gravitational-wave signal that would have reached Earth is computed. By systematically cataloging which parameter combinations lead to good agreement with the measured data, we can learn about different aspects of the true source. This whole process is called parameter estimation and you can read more about it here.
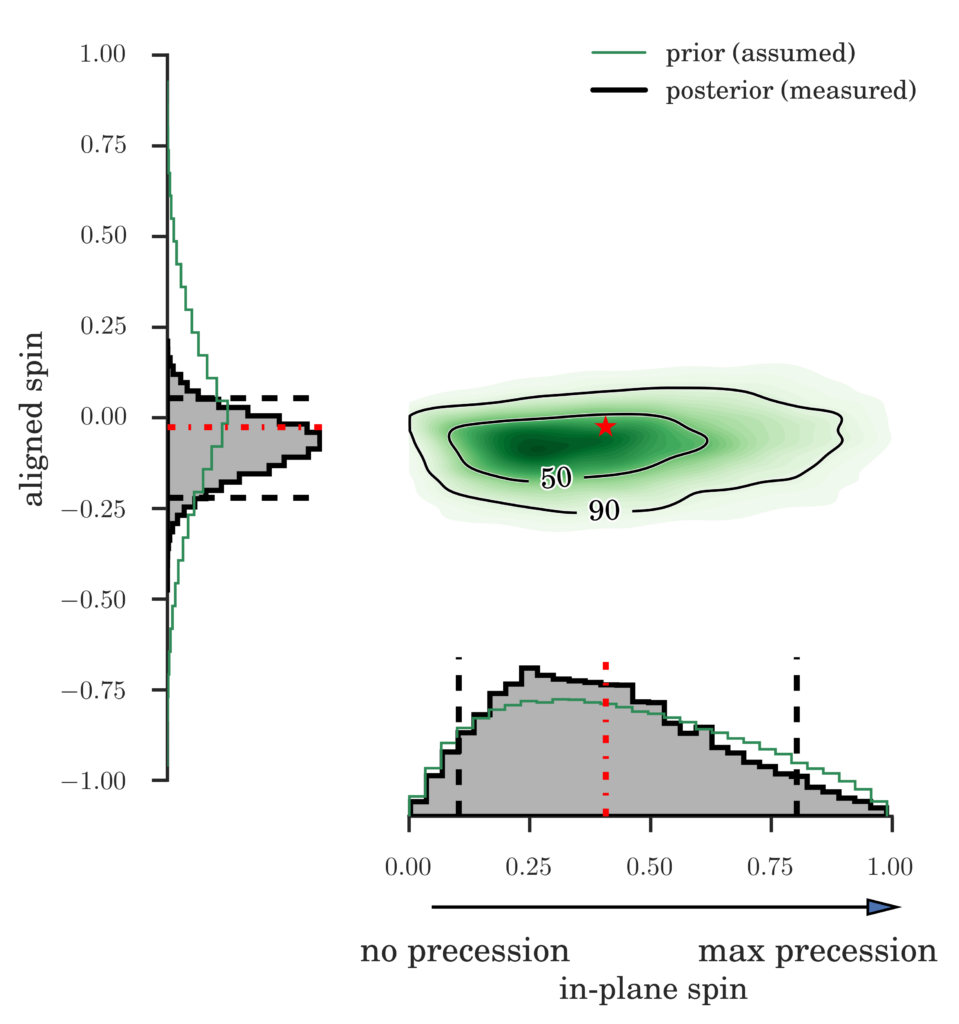
Figure 2: This image shows which combinations of the black hole spins, in units of the maximum possible spin, are consistent with the numerical relativity mock signal. The true values of the spins are indicated by a red asterisk and red lines – similar to Figure 1.
What is a “ gravitational-wave model”?
You can imagine a gravitational-wave model as a box with some dials where you can set the parameters of the black hole binary. Once you have decided on the binary you want, you can press a button and out comes the corresponding gravitational waveform. The waveform is a sinusoid with a frequency (how fast the wave oscillates) and amplitude (how strong the wave is) that increases with time as the two black holes come closer and closer together until they merge into a single black hole. This waveform pattern is also known as a “chirp”. After the merger of the black hole binary the gravitational-wave signal decays very quickly until it vanishes completely. The actual gravitational-wave models we use are rather complex mathematical descriptions turned into computer programs. To find out more about the waveform look at page 6 of this edition of the LIGO magazine.
So, then, are our waveform models any good?
What models did we use?
For a set of binary parameters, the correct way of calculating what the corresponding gravitational wave looks like is to solve Einstein’s equations. Unfortunately, these equations are very difficult to solve for black hole binaries. The most accurate waveforms can be computed from numerical relativity simulations. Typically, a single numerical relativity waveform requires large super computer simulations running on hundreds of CPUs for several months. Since the generation takes so long, they would be much too slow to be used directly as a model of gravitational waves. Instead, we resort to models using sophisticated approximations that incorporate information from the numerical relativity simulations we have available.
How we can test our models
In this study we investigate how good the approximations in the waveform models are and whether they give the correct answer for systems similar to GW150914. To answer this question we can proceed as follows: Instead of analyzing the data recorded for GW150914, we can use a mock gravitational waveform signal from numerical relativity that mimics the true gravitational-wave signal and perform parameter estimation on it. In that case, we are in a situation where we know what the correct parameters of the mock source are, and can compare these against the estimates obtained from the models. This tells us how well our theoretical waveform models are doing in extracting the true parameters of the source.
As our waveform models are just models, they do not necessarily describe all the physics correctly. In our analysis, we look into several physical effects that are not fully described by the waveform models we use: We investigate mock signals from black hole binaries that precess like a spinning top, from binaries where the orbit is eccentric (it looks like an ellipse rather than a circle), and from systems where we include higher excitations in the signal. We also check how well the models do when we happen to look directly at the plane of the orbit of the black holes, or when the orbit is tilted more and more so that we see the orbit from its side and the black holes appear to us to move back and forth along a line.
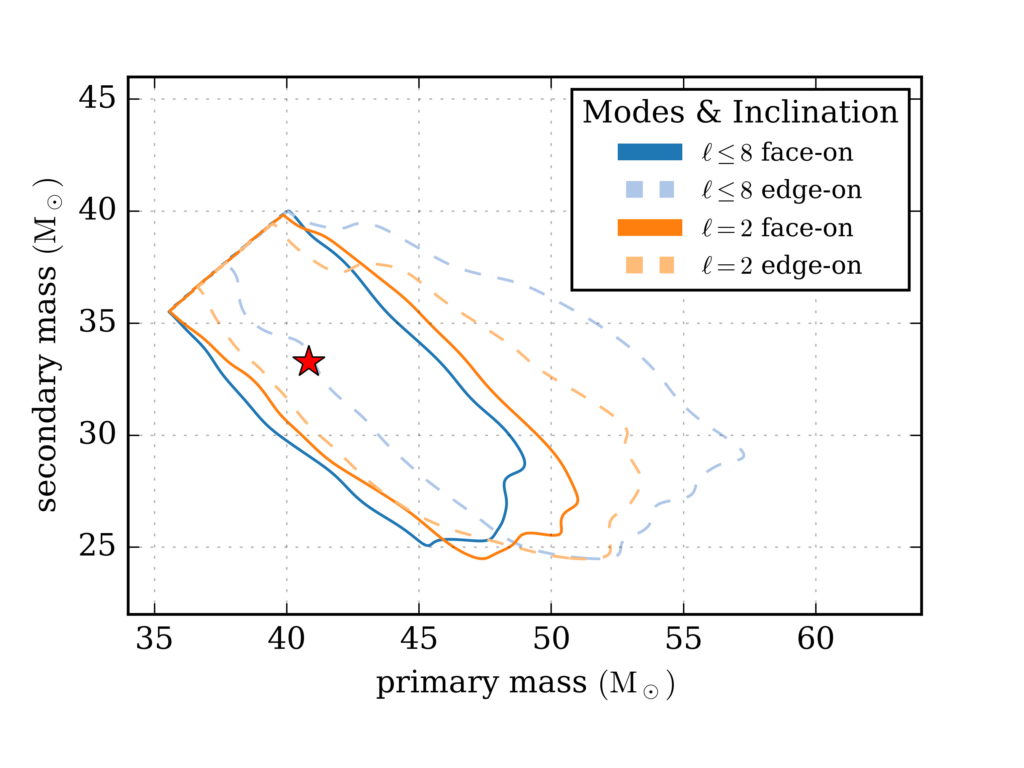
Figure 3: As in Figure 1 this image shows which combinations of the black hole masses, in units of the mass of the Sun, are consistent with the numerical relativity mock signal. In contrast to Figure 1, we show here results for signals that do (l <=8) or do not (l=2) include higher excitations in the waveform. The source is either viewed “face-on”, so that we see the orbit of the two black holes as a circle, or “edge-on” so that the orbit appears as a line. The true masses are indicated by a red asterisk.
What we learned
We found that our current gravitational-wave models gave an accurate answer for GW150914. We still have more work to do to make sure that our models will be good enough for future gravitational-wave events that our Universe allows us to see. To do this we will need to make more comparisons against numerical relativity simulations and continue developing even better and more sophisticated waveform models.
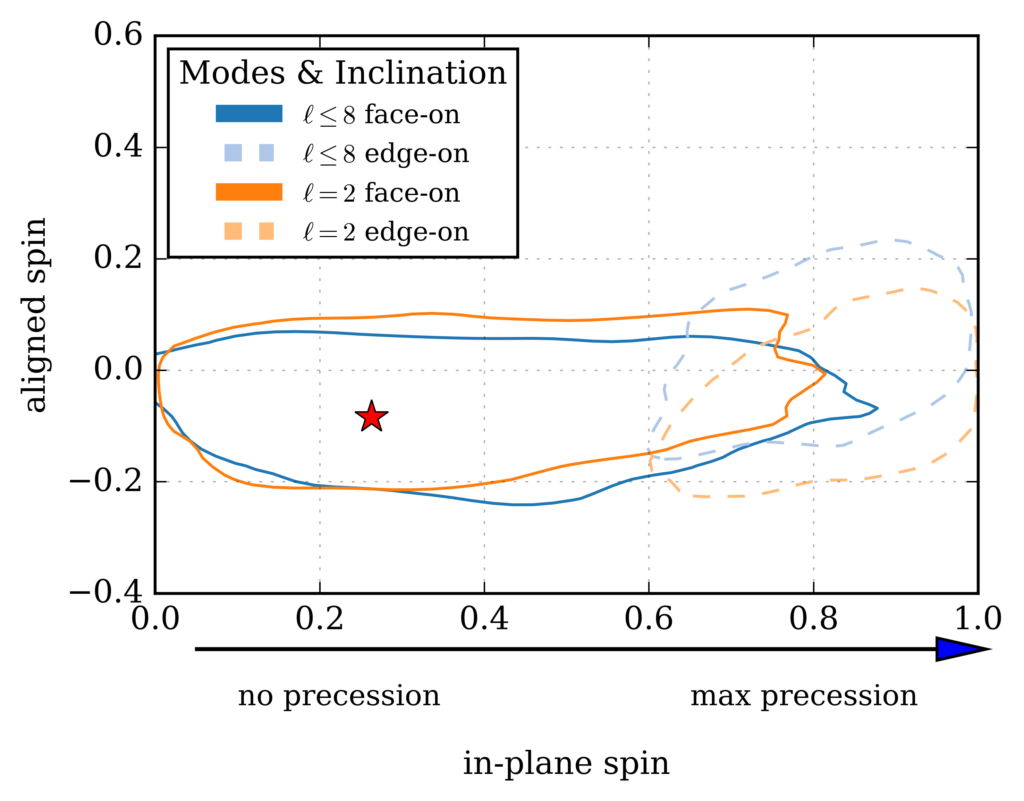
Figure 4: As in Figure 2 this image shows which combinations of the black hole spins are consistent with the numerical relativity mock signal. As in Figure 3, we show here results for signals that do (l<=8) or do not (l=2) include higher excitations. We note that when the binary is viewed “edge-on”, the estimated spin values are far from the true values, which are indicated by a red asterisk.
Learn more about numerical relativity:
Introductions to numerical relativity can be found in the following references:
- Textbooks: Baumgarte and Shapiro, Alcubierre
- Physics Today article (Baumgarte and Shapiro)
- Review articles: Sperhake 2015 and Centrella et al 2007
Visualizations:
The two numerical relativity groups participating in this study have visualized the dynamics and gravitational waves of GW150914-like black hole binaries based on their simulations.

