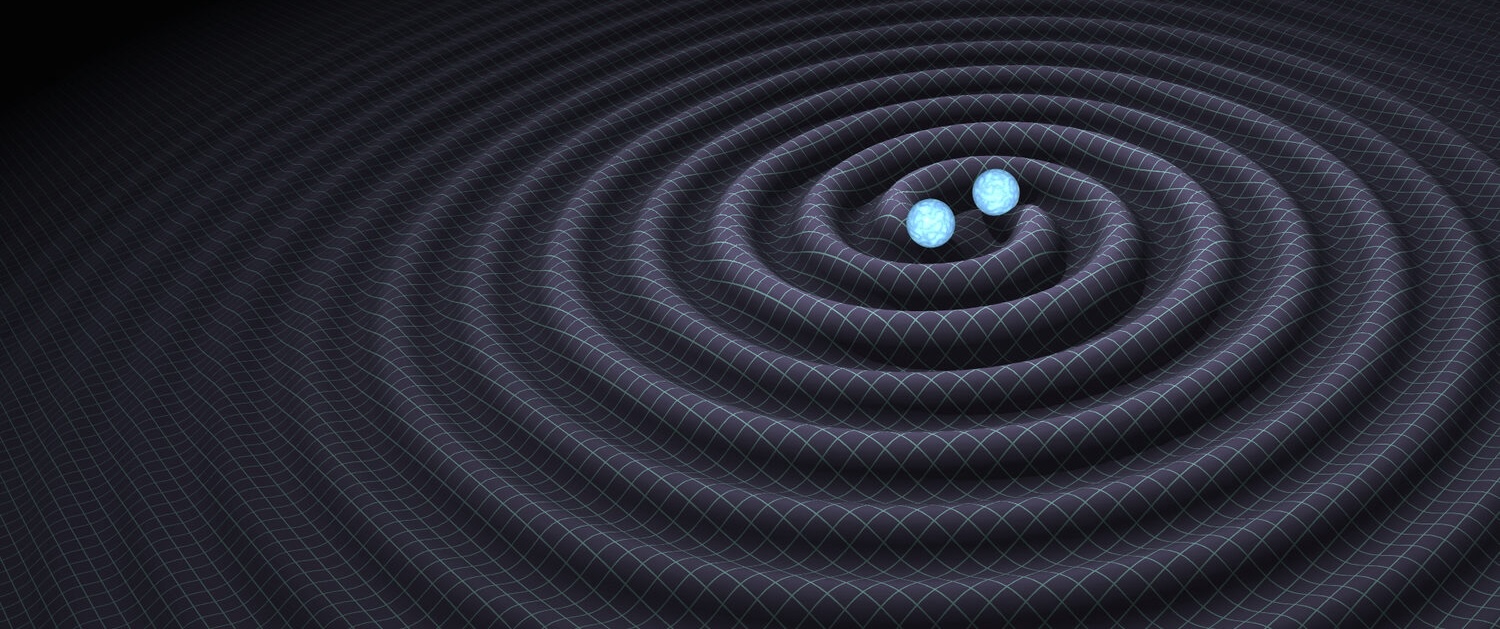
Gamma-ray bursts (GRBs) are extremely bright flashes of high energy gamma rays from deep space that we see approximately once per day. The gamma-rays are beamed into narrow cone-like jets and are so bright we can see them from billions of light years away.
There are at least two different types of astrophysical events that can produce a GRB. ‘Long’ duration GRB are more common (about 70% of all GRB) and have been associated with supernova explosions, supporting the idea that this category of bursts come from massive dying stars as their cores collapse. The GRB produced this way tend to last from a few seconds up to many minutes.
‘Short’ duration GRB may last anywhere between a few milliseconds up to a few seconds at most. We think most, if not all of the short GRB, are caused by colliding pairs of extremely dense stars called neutron stars, or perhaps when a black hole rips a neutron star apart in the process of engulfing it. In both GRB scenarios a very large amount of matter may be violently accelerated in ways that could send out GW towards us. An example of this was GW170817, a GW which accompanied a short GRB from a nearby galaxy.
It’s very important that the GW astronomers monitor GRB detections by Fermi and the Neil Gehrels Swift Observatory, two gamma ray space telescopes. When they report a new GRB has been detected, we can check if LIGO and Virgo data contain a GW coming from the same direction and at the same time. By following this approach we can detect weak GW that we might otherwise miss.
How we hunt for Gravitational Waves
We use two different techniques to hunt for these signals. The first technique doesn’t care about the shape a gravitational wave signal could have; only that it would appear consistently in the LIGO and Virgo observatories. This means it could find GW made by neutron star collisions or collapsing stars. We call this the ‘generic’ search method and we use it whenever a GRB happens and our gravitational observatories are taking data. Our second technique only looks for signals with a specific kind of shape, called a chirp. This type of signal is produced when pairs of dense star-like objects spiral around one another and eventually collide, including pairs of neutron stars or a black hole and neutron star pair. For this reason, we only use this ‘modeled’ search when we think a GRB might be ‘short’, i.e. produced by such a collision. We decided to use this when a GRB lasted for 4 seconds or less as this should avoid us skipping a short GRB by mistake.
The results of our gravitational wave searches
Between April and September 2019, LIGO and Virgo carried out a period of data taking, called O3a. During this time we ran our generic method for a set of 105 GRB, and our modeled method for the 32 shortest ones. We did not find any GW associated with any of these GRB (see Figures 1 and 2 for more details). This is not necessarily unexpected for two reasons. Firstly, as the bursts are beamed into narrow cones of gamma rays, a large proportion will be beamed away from the earth and missed. Secondly, as most GRBs happen very far away, it’s rare for one to come from within the distance our GW observatories are sensitive to.
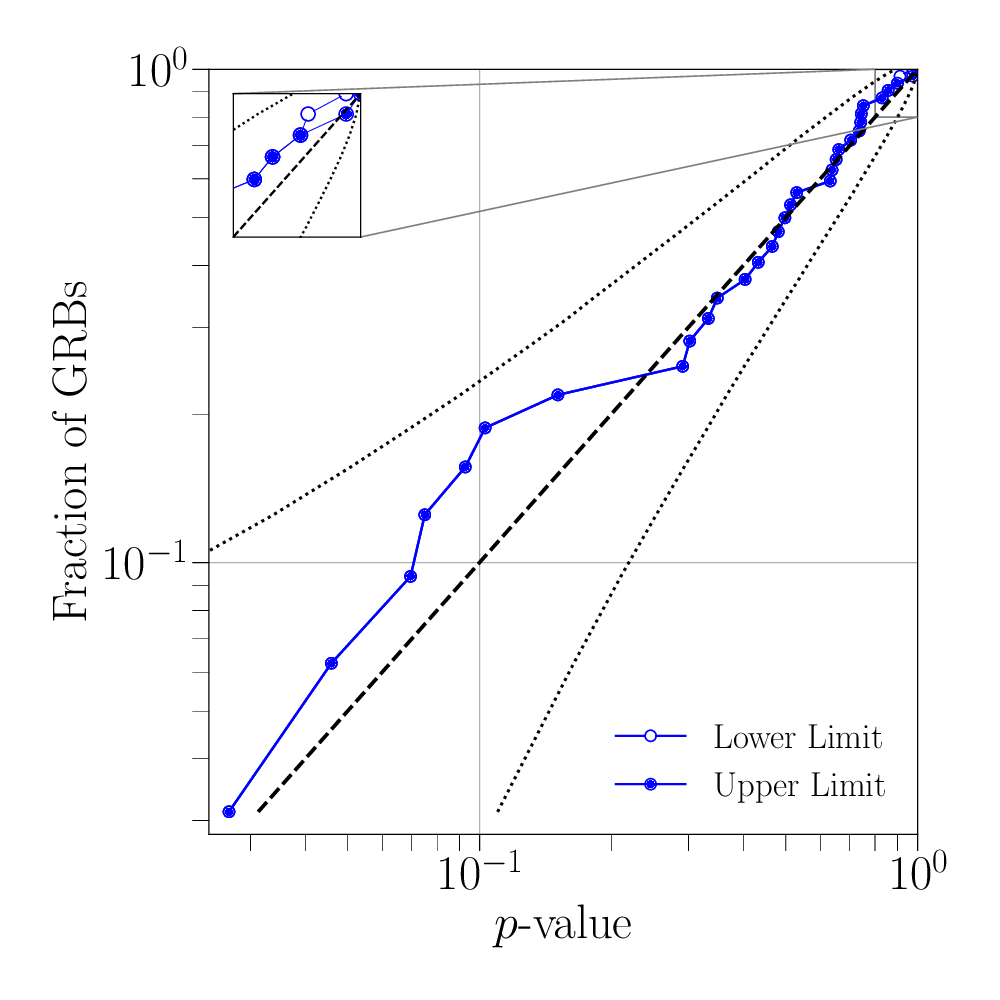
Figure 1: The modelled search reports the best candidate GW event for each short GRB, along with a measure of its strength. We compare this with data from other times to estimate the probability that the candidate is the result of noise, not a GW (the p-value). Here we show our 32 candidates (joined dots), with the horizontal axis giving the candidates’ p-values and the vertical axis showing the fraction of candidates that have a lower p-value. The dashed line shows the curve one would expect from just background detector noise and random chance (and no GW signals). The larger a candidate’s p-value (further towards the right-hand side), the greater the chance it is a noise event and not a GW. The dotted lines show the limits on the expected statistical behaviour of noise in our searches. We see that all the candidates (shown by connected dots) are within the dotted lines, meaning all are consistent with what one would expect from background detector noise.
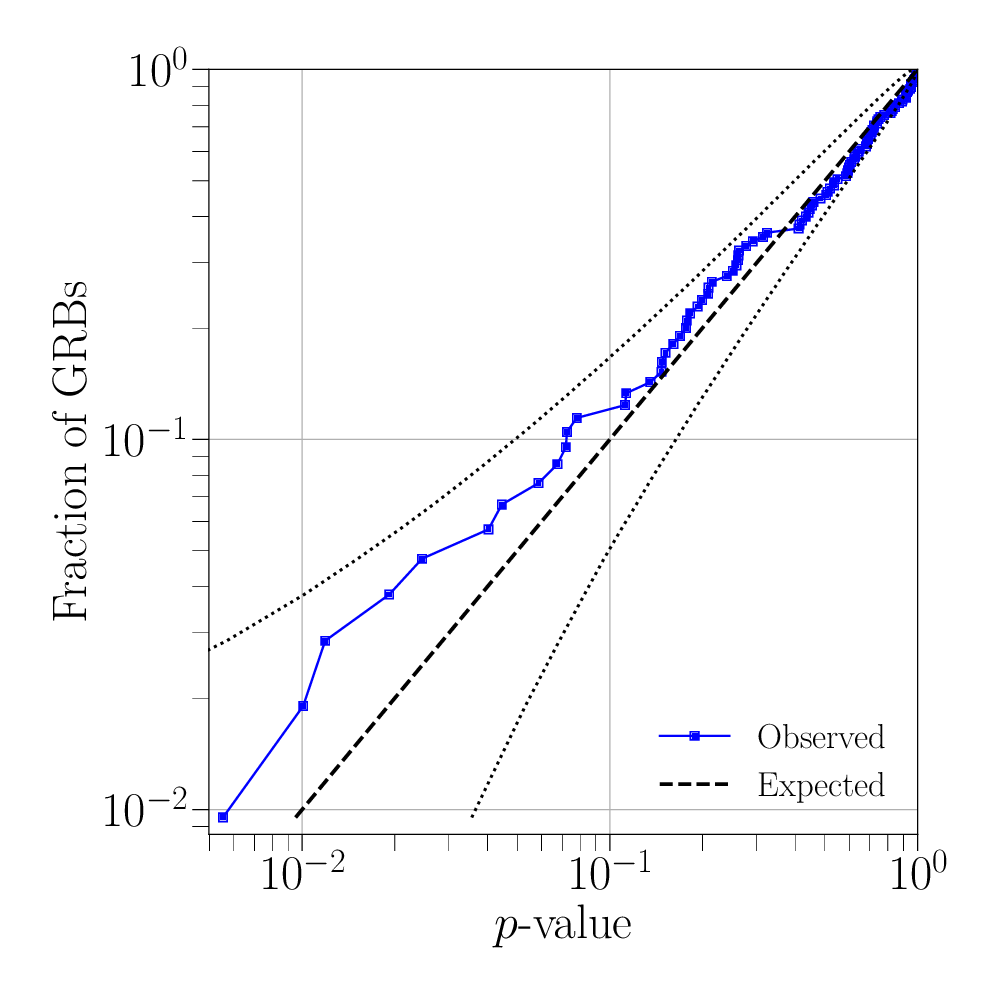
Figure 2: The plot above shows similar statistical results as for Figure 1 but for the generic burst searches around 105 gamma-ray bursts.
When we don’t find a GW signal corresponding to a GRB, we measure the distance to which our observatories would reliably detect various types of signals by adding fake GW to our data and seeing which ones our methods find. This allows us to say, for each GRB in our set, that if the GRB also produced a certain type of GW, it must have happened further away than a certain distance. If it had been any closer, we shouldn’t have missed the GW from it. The results from all our searches produce a measure of this quantity, which we call an ‘exclusion distance’. These are shown in the Figures 3 and 4.
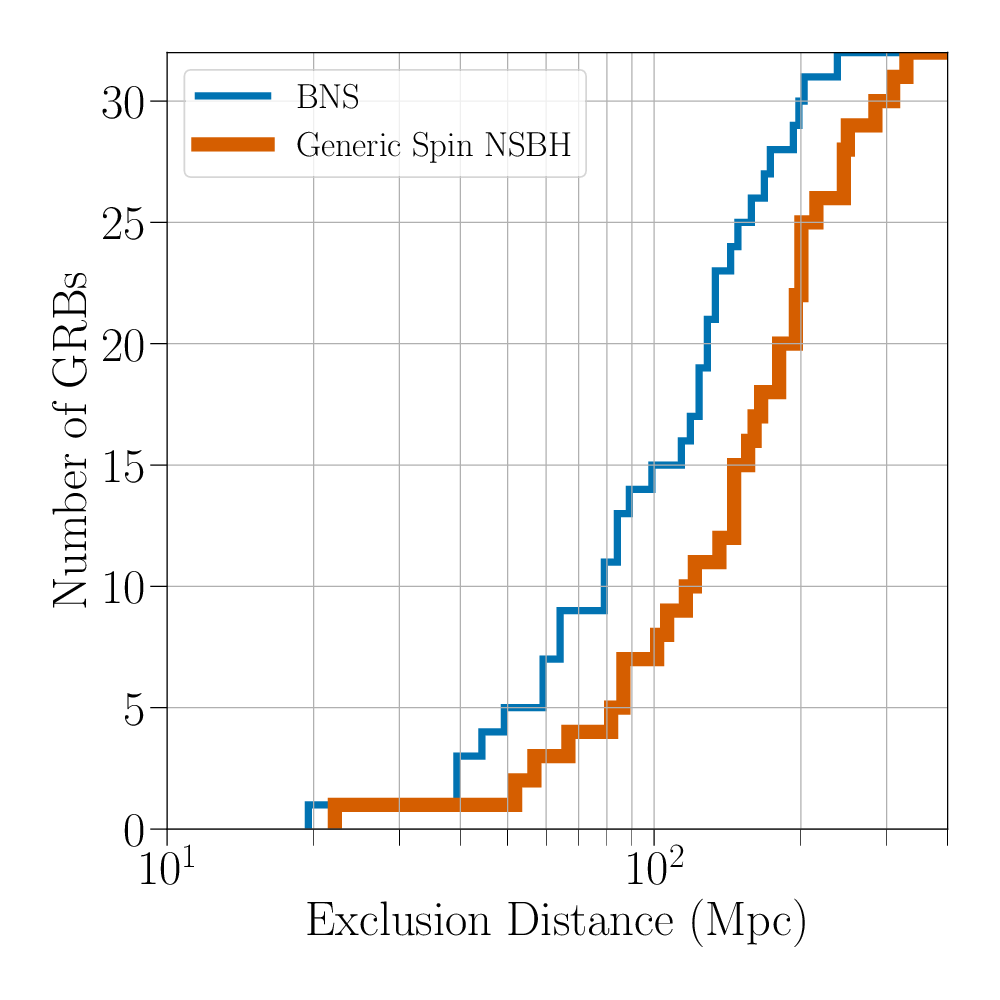
Figure 3: In this plot we show the number of gamma-ray bursts with exclusion distances of less than or equal to a certain value, as calculated by our modelled search. The exclusion distance for each search tells us the closest distance a gamma-ray burst could have been without a gravitational wave (assuming a particular model) being detected. We calculate these distances by adding fake gravitational wave signals of different strengths into the data around the occurrence of a particular gamma-ray burst. The closest distance at which less than 90% of these fake signals are found is the exclusion distance and it tells us that assuming a particular type of gravitational wave signal, i.e. a binary neutron star (BNS – thin line) or a neutron star – black-hole merger (NSBH – thick line), the gamma-ray burst must have occurred outside this distance. The distance axis is in units of Megaparsecs (Mpc).
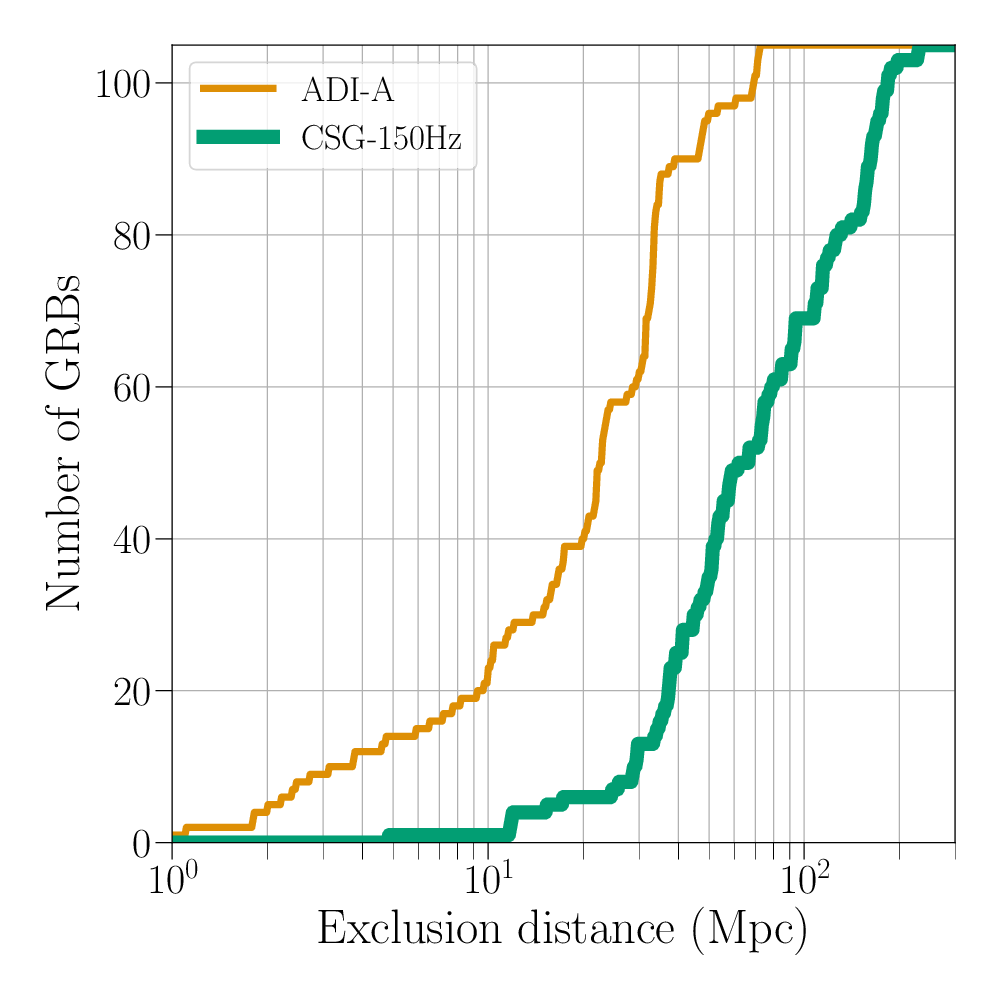
Figure 4: The same type of plot as for Figure 3 but for a more generic method that does not assume chirp-like signals. The fake gravitational wave signals used this time are based on two possible emissions from gamma-ray bursts. The first model is called ADI-A, and models gravitational wave radiation from a large lump of matter within a disk of material around a black-hole. The second, CSG, represents a circular sine-Gaussian signal, a simple approximation of a burst of gravitational waves. The distance axis is in units of Megaparsecs (Mpc).
The case of GRB 190610A
Our estimates can also place constraints on GRB without known distances. For a large percentage of GRB the distance is not known. One interesting case is GRB 190610A, for which our modeled method tells us that if GRB 190610A was produced by two colliding neutron stars, it is most likely to have happened more than 63 Mpc (around 200 million light years) away. This GRB came from a direction very close to a galaxy that lies 165 Mpc (around 600 million light years) away, so we cannot rule out from our analysis that a neutron star pair collided in that galaxy and produced the GRB (this is shown in Figure 5).
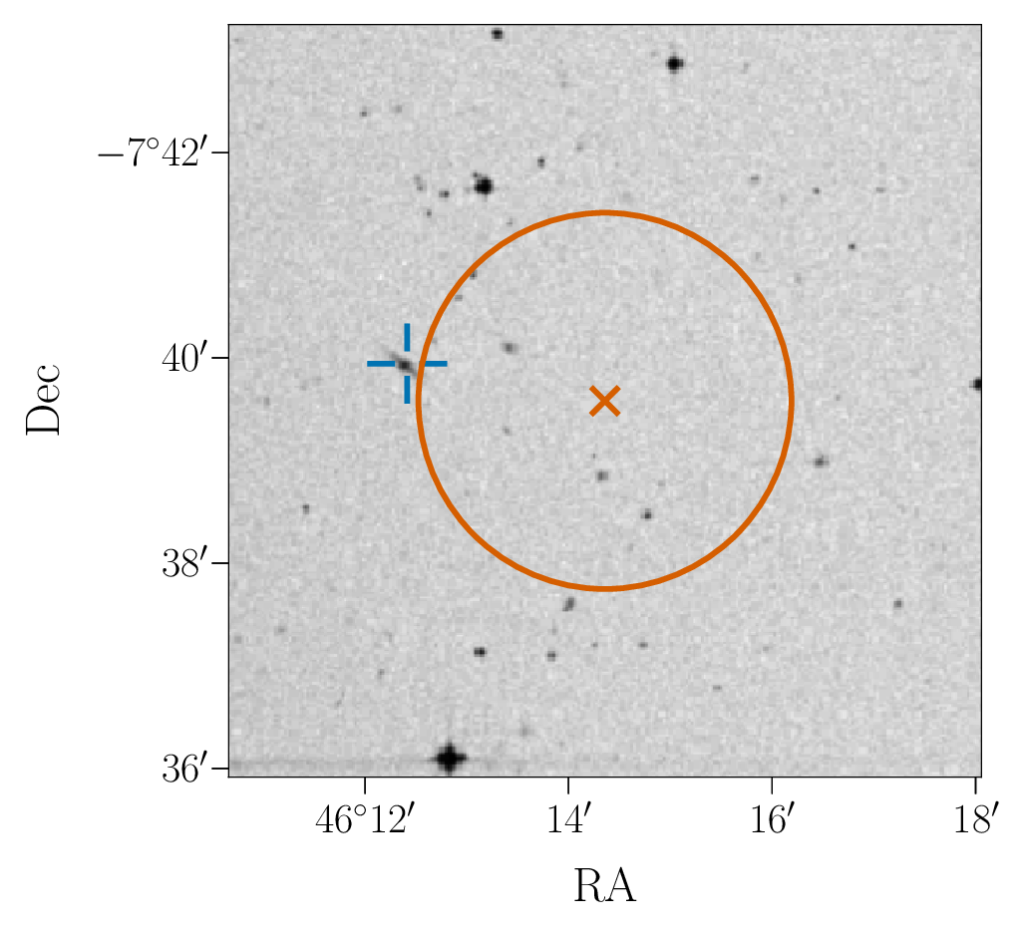
Figure 5: In this plot the large circle indicates the error box for GRB190610A, a burst that could have occurred within a Galaxy at 165 Mpc (around 600 million light years away), shown by the cross-hairs. This is greater than our exclusion distances for this gamma-ray burst so we cannot rule out this possibility.
Looking ahead
Although the O3a run produced no GW from any GRB (as occurred in August 2017 when we observed GW170817) plans and work are under way to improve our detectors. As GW observatories get more and more sensitive, we will have an ever greater chance of detecting more GW associated with GRB. Combining the information we get from the individual GW and GRB can provide valuable new insights on the mechanisms and properties of these enigmatic bursts of gamma-rays.
Find out more:
- Visit our websites: ligo.org, www.virgo-gw.eu
- Read the full article, free and online here.

