
We present an updated search for the isotropic stochastic gravitational-wave background (GWB) using Advanced LIGO data from the first three phases of the fourth observing run (O4a–O4c1), combined with data from previous observing runs. While no evidence for a GWB signal is found, the increased observation time and improved treatment of instrumental noise enable more stringent upper limits on astrophysical and cosmological GWB models. We also perform dedicated checks for correlated magnetic noise and find no significant contamination. These improved constraints provide stronger limits on the compact binary coalescence background and the evolution of binary black hole merger rates.
The gravitational-wave background (GWB) is the superposition of tens of thousands of signals which are too weak to be detected individually, and it is composed by all kinds of signals such as compact binary coalescences (CBCs), core-collapse supernovae, and rotating neutron stars, which are categorized as “Astrophysical sources”, as well as cosmic strings, phase transitions and inflation, among others, which are categorized as “Cosmological sources”. The ensemble of these sources, the GWB, has an amplitude that can be estimated statistically by cross-correlating all the time-domain data from different detectors. In this search, we assumed that the GWB is isotropic (i.e. equal in all directions on the sky).
In the first part of the observing run , known as O4a, the LIGO Virgo KAGRA collaborations (LVK) collected 108.41 days of data from the Advanced LIGO observatory. Although there was no evidence for a signal, we still provided conservative upper limits for different models. In this paper, the main detection strategy remained the same as in O4a, but we also included 117.05 days of data from the O4b and O4c1 observing runs, collected between 17:00 UTC on 10 April 2024 and 15:00 UTC on 1 April 2025. Even though the Virgo detector joined the observing run at the beginning of O4b, we did not include Virgo data in our analysis given the very limited improvement that the data could offer to the final results.
As we accumulated more data from the O4 observing run, new challenges arose in terms of data quality. We noticed that some noise features in the data (e.g. mechanical resonances of optical components in low-frequency regions, sideband features associated with harmonics (i.e. multiples of the frequency) of power lines, all along the entire frequency domain, and other instrumental features in high-frequency regions) were found all across the frequency spectrum from 20 to 1726 Hz. We therefore adopted a more robust method to remove, or notch, these undesired sources of noise by applying a series of frequency-domain cuts to the data known as a notchlist. As a result, this methodology produced two distinct notchlists: one for the O4a dataset, which was an updated version of the one in our previous paper, and one for the O4b-O4c1 dataset. Consequently, we also report in this paper updated results for observing runs O1 to O4a.
In Table 1, we report updated upper limits for the amplitude of the GWB, at the 95% confidence level, obtained from the O1-O4a data, as well as those from O1-O4c1, for different spectral indices depending on which sources we assumed as predominant. The constraints from the O1-O4a dataset are different from those in our previous paper because of the adoption of the new notch list, mentioned above, but these differences are not significant. However, when we include the data from the O4b and O4c1 observing runs, these improve the upper limits by a factor 1.3 to 1.5.
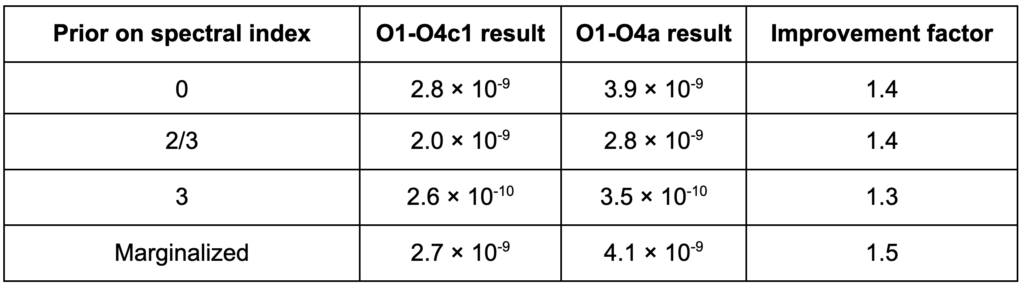
Table 1: Upper limits on the amplitude of the GWB for different models, namely, a simple power law with different spectral indices, equal to 0, 2/3 and 3, representing GWBs mainly sourced by Inflation or Cosmic strings, CBCs, or supernovae, respectively. Additionally, we assumed a case in which we marginalize, or average, over different values of the spectral index.
We also determined upper limits on a GWB with different modes of polarization (known as vector or scalar modes) which are predicted by alternative theories of gravity but are “forbidden” in Einstein’s General Relativity (which allows only so-called tensor polarization modes). Observing a GWB with these different polarization modes would imply that General Relativity needs to be modified. However, we have found no evidence for these “forbidden” polarizations, and we therefore set more stringent upper limits on vector and scalar polarized GW backgrounds than in previous analyses.
In our analysis, we assume that the noise in different GW detectors is uncorrelated. This means that we can cross-correlate the data from at least two different detectors and effectively suppress instrumental noise. However, globally correlated noise due to magnetic phenomena, such as Schumann resonances, can induce correlated signals between different detectors and potentially lead to the misidentification of magnetic noise as a GWB signal. To evaluate this possible source of contamination, we use two complementary methods.
First, we monitored magnetic noise using sensors placed near the detectors. Data from different magnetometers were cross-correlated to estimate the magnetic noise in individual frequency bins. We then evaluated whether the combined effect of magnetic noise across multiple frequency bins exceeds the sensitivity threshold. However, from considering either individual frequency bins or combining across multiple bins, we found that the cross-correlated magnetic noise is well below the sensitivity threshold, except for narrow-frequency features that were introduced by the Overlap Reduction Function (ORF; this is a geometrical function that accounts for the fact that detectors are neither co-located nor co-aligned) and harmonics of the 60Hz power line (see Figure 1). Therefore, we concluded that correlated magnetic noise is not affecting our results.
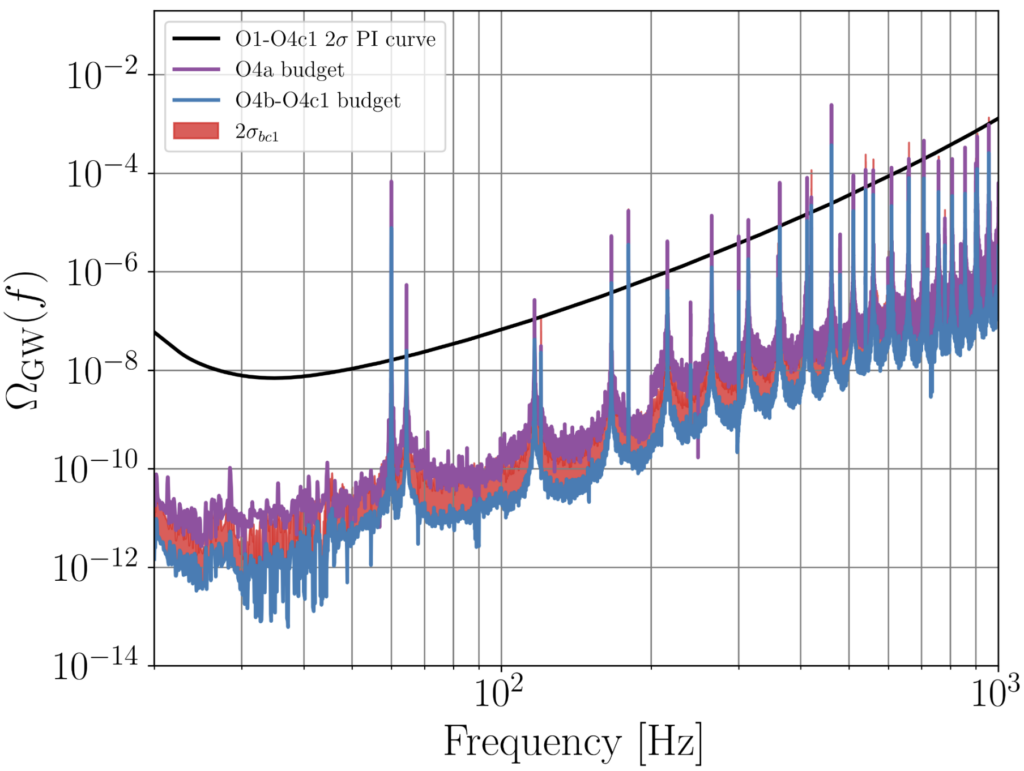
Figure 1: The estimated magnetic budget, i.e. the energy density of correlated magnetic noise, as a function of frequency. The magnetic budget for the O4a analysis is shown in purple and the O4b–O4c1 magnetic budget in blue. The black curve labeled “O1–O4c1 2σ PI” shows the sensitivity to a signal. The red band represents the 2σ uncertainty for the O4b–O4c1 budget, meaning we are 95% confident that the true value will fall within this range. Note that, apart from some specific narrow-frequency features, the O4a and O4b-O4c1 magnetic budgets lie well below the sensitivity threshold. The O4b–O4c1 budget is lower in amplitude compared with O4a because the magnetometer calibration factors were re-measured during O4b, yielding more accurate values than those used in the O4a analysis.
As another method for evaluating the possible impact of magnetic noise contamination, we also performed a joint Bayesian inference analysis. We constructed three different models: a Gaussian noise-only model, a magnetic noise-only model, and a joint GWB and magnetic noise model. The Bayes factors obtained from comparing these models show that there is no preference for correlated magnetic noise in our data. This provides an additional check that magnetic noise is not affecting our results.
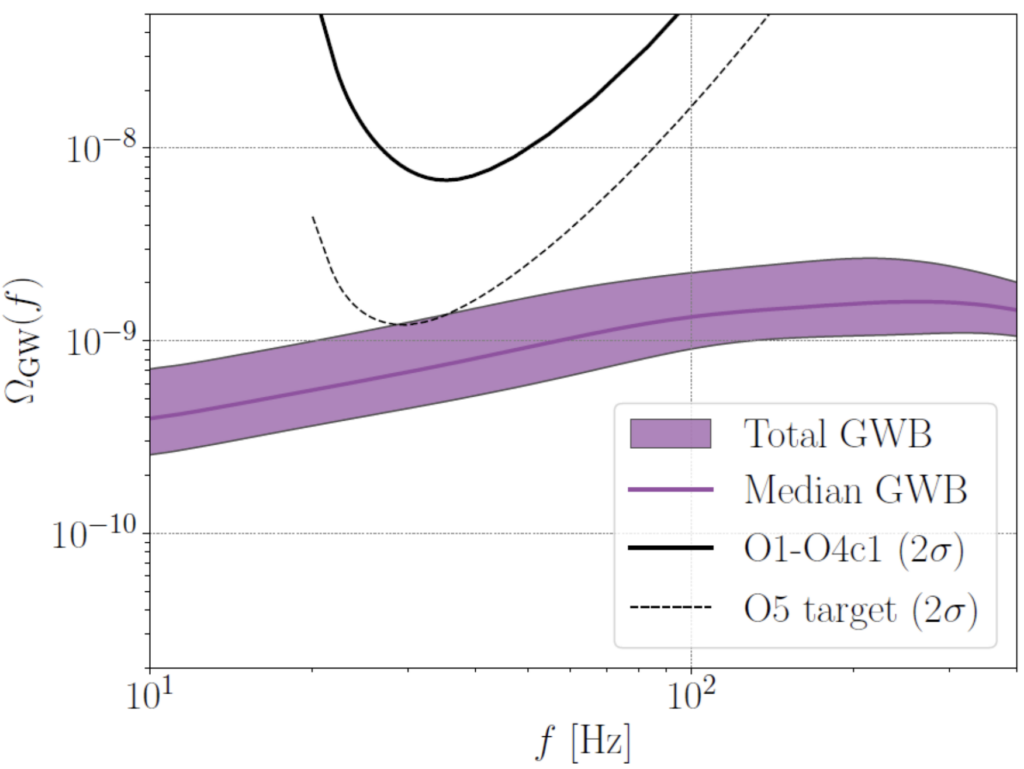
Figure 2 (Fig 6 from our paper): Comparison of the predicted total background from BBH, BNS, and NSBH with the current and projected sensitivities of the detector network. The solid black curve shows the O1–O4c1 sensitivity to the GWB, and the dashed black curve shows the target sensitivity for O5. The purple curve and shaded band show the median estimate of the total background and its credible region at the 90% confidence level, i.e. the region within which there is a 90% probability that the total GWB could lie.
In the frequency band of our detector, which is approximately 10–2000 Hz, the most promising astrophysical source of a GWB is the combined signal from many distant CBCs, including binary black holes (BBH), binary neutron stars (BNS), and neutron star–black hole binaries (NSBH). We updated the estimated energy-density spectra (i.e. the energy density as a function of frequency) arising from these sources and compared them with both the sensitivity curve of the search reported here and the projected target sensitivity of the LIGO detectors in their fifth Observing Run, O5; this is shown in Figure 2. We found that the CBC background may approach the target sensitivity expected for O5. In particular, for the population of BBH sources, we combined the direct BBH detections from our latest published GW catalog GWTC-5.0 with the stochastic GWB upper limits reported here, to infer the redshift evolution of the BBH merger rate density (see Figure 3). This shows a significant improvement in the upper bound on the stochastic GWB compared with the results reported for our previous O4a analysis in this summary.
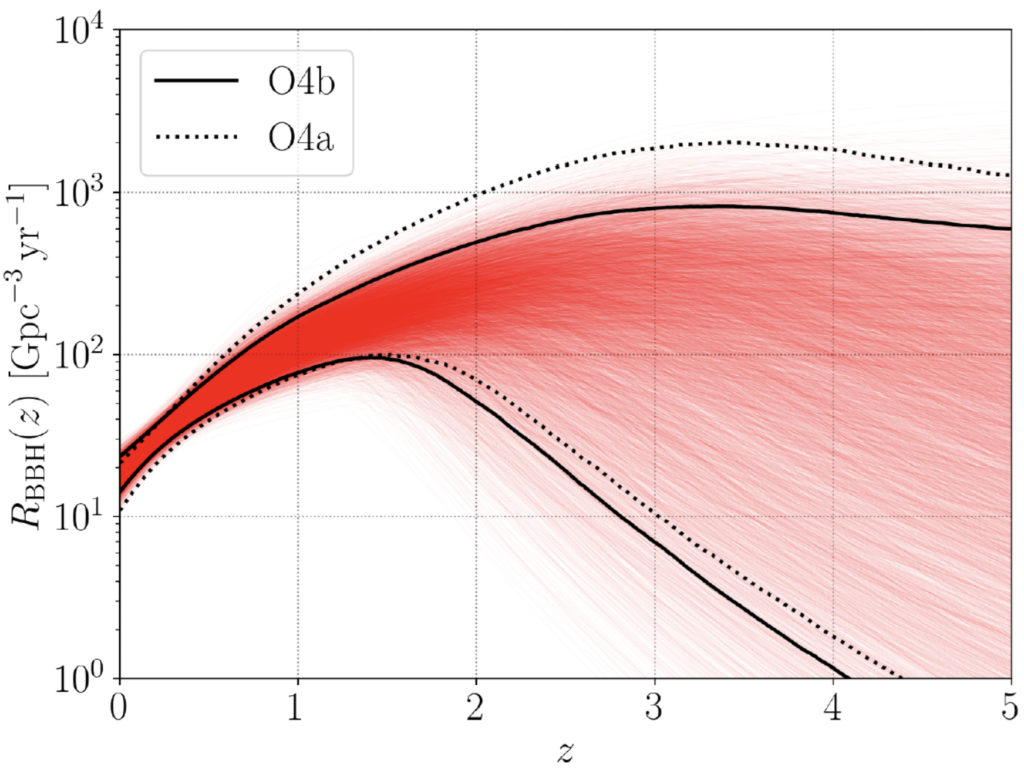
Figure 3 (adapted from Fig 4 in our paper): Inferred redshift evolution of the BBH merger rate density, measured hierarchically using the direct BBH detections in GWTC-5, that included O4b, and the GWB upper limit. Solid black and red curves show, respectively, 90% credible bounds and individual samples estimating the redshift evolution. Additionally, the 90% credible bounds obtained previously with GWTC-4 (that included O4a) are indicated by the dotted lines.
Find out more
- Visit our websites:
- Read a free preprint of the full scientific article:
https://dcc.ligo.org/P2600217/public/ or https://arxiv.org/abs/2608.23477 - Information on the general concept of gravitational waves:
https://ligo.org/gravitational-wave-science/ - Read more about the advantages of multiple detectors for gravitational-wave searches: https://ligo.org/science-summaries/GW170814/
- Find out more about “forbidden” polarizations in general relativity:
https://ligo.org/science-summaries/O1StochNonGR/.
Back to the overview of science summaries.