Einstein’s General Theory of Relativity predicts that rapidly rotating neutron stars with a small deviation from perfect axial symmetry emit continuous gravitational waves. Although a number of potential sources are known, no direct detection has been made yet. With this work we aim to find continuous gravitational wave signals emitted by neutron stars located at the Galactic Center.
What’s so cool about the Galactic Center?
The inner region of the Milky Way is believed to host hundreds of neutron stars, but they are hidden by dense clouds of dust and gas. When this search was performed, no neutron star was known in that area. It is only very recently that the first neutron stars have been detected with X-ray and radio observations in the close neighborhood of Sagittarius A*. However, a large number of massive stars have been observed in its vicinity. This is interesting for us, because these stars are the progenitors of neutron stars. When they explode as supernovae, they are likely to leave behind a neutron star. Gravitational wave astronomy provides a new, intriguing way to search for signals from such stars.
Why is the detection of gravitational waves so difficult?
Gravitational waves interact only very weakly with matter. Therefore, we need very sensitive detectors and an effective data analysis method to dig out the signal from the noise. For this, we need an accurate model of the signals we want to find. They can be described by a handful of parameters: their frequency, spindown (the rate with which the frequency changes over time) and sky location. This search concentrates on a single point in the sky (the Galactic Center). The other two parameters are, in principle, related to the properties of the emitting star, but since we have no knowledge about sources at the Galactic Center, these two parameters are unknown. That means, we have to search over a large variety of different signals; the more, the better! This search covers a total of 4.4×10¹² (= 4.4 trillion = 4400 billion) different signal wave forms (called templates), with frequencies between 78 and 496 Hz and spindowns between 0 and -7.8×10⁻⁸ Hz/s (= -0.000000078 Hz/s).
Searching for such a huge number of different gravitational wave signals is computationally very demanding because each single template has to be compared against the data. To solve this problem, efficient analysis procedures have been developed. In the analysis method used for this search, the data is divided into smaller segments of a certain length. The analysis is then performed on the shorter data segments, and the results are combined afterwards. This is, in principle, a less sensitive method than analyzing a single long data stretch as a whole, but it allows to run a search over a much larger number of templates and a larger total amount of data.
What data is used and how is the analysis done?
The data used for the analysis come from the two 4-km-long LIGO detectors. They were recorded between November 7th, 2005 and October 30th, 2007. They are divided into 630 smaller segments, each of length 11.5 hours, which are distributed over almost 2 years. The different signal templates are, one by one, compared against this data set, and, for each template, a significance value is computed. This value tells us how likely it is that a gravitational wave with the template parameters exists in the data. The hierarchical procedure described above helps reduce the computational requirements, but doing the search still required thousands of computers running for about a week. The search was split into 10678 smaller pieces which each reported the significance values of the 100,000 most promising (= most significant) templates.
What to do with a billion candidates?
The search returned a total of 1,067,800,000 template-significance-combinations (called candidates). As mentioned above, the significance value tells us how likely it is to have a signal with the given parameters in the data. However, most candidates have a high significance value not because they are gravitational wave signals. Significant candidates can be terrestrial disturbances or have their origin in the detectors (e.g. AC power line harmonics, mechanical resonances). Candidates that can be ascribed to disturbances of the detectors are removed upfront. Subsequently, we check the candidates for their physical behavior. Does the gravitational wave appear in the data of both detectors? Unlike local disturbances, a true signal would be found in the data of both detectors with consistent properties. Is the signal present during the whole observation time (about 2 years) as we expect it for a continuous gravitational wave signal? Does the strength of the signal increase when we enlarge the data stretch in the analysis? These are simple but powerful tests to differentiate between potential signals and noise. Unfortunately, none of the candidates survive all of these tests. We did not detect a gravitational wave with this search.

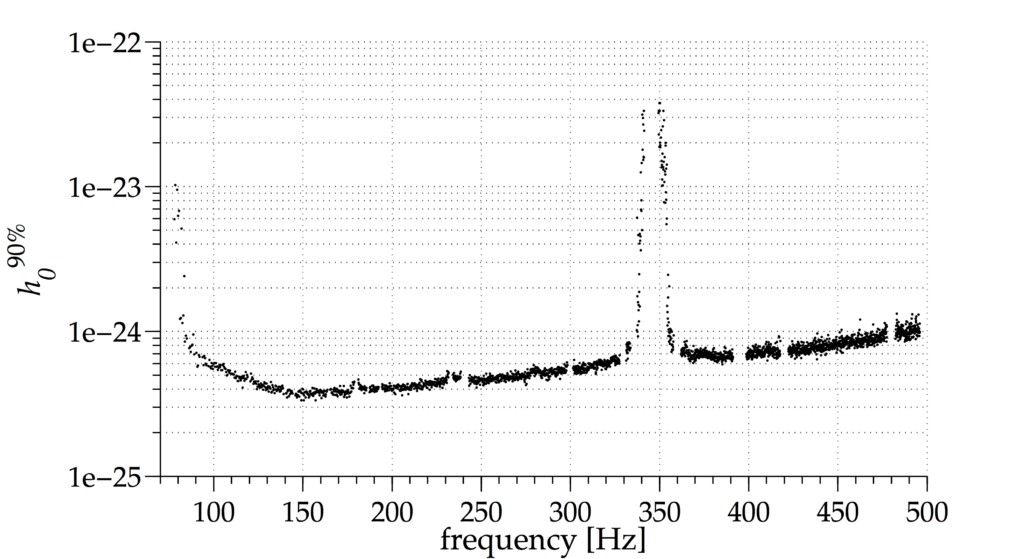
Figure 1. This plot shows the upper limit on the strength of a gravitational wave signal coming from the Galactic Center over the searched frequency range. The value on the vertical axis is called “90% confidence upper limit” and it means that, if a gravitational wave signal with a strength as high as this or louder exists in the data, we are 90% confident that we would have detected it. The numbers vary over frequency, because the detectors are differently sensitive at different frequencies. The tightest upper limit is 3.35×10⁻²⁵ at 150 Hz. The highly increased values close to 350 Hz are due to mechanical noise from oscillations of the wires suspending the LIGO mirrors.
No gravitational wave signals? Why is this result interesting?
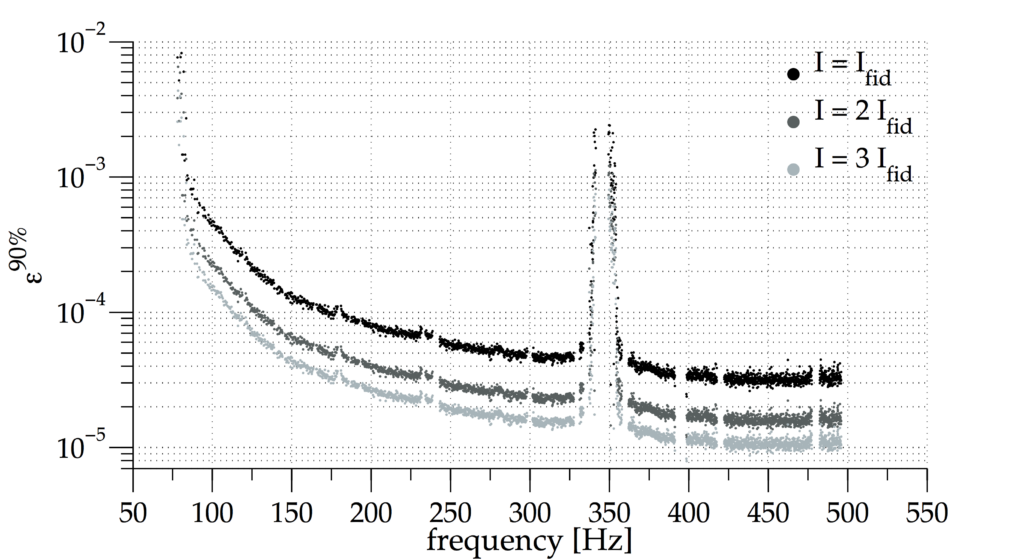
Of course, a detection would have been more exciting. Even so, the non-existence of a gravitational wave signal allows us to set an upper limit on the gravitational wave strength in the searched frequency and spindown band and for the searched sky location. That means we can define a maximum strength that signals from the direction of the Galactic Center can have. These values are determined with 90% confidence. In other words: if a gravitational wave signal with a strength as high as our upper limit or louder exists in the data, we are 90% sure we would have detected it. The limits found by this search are the most constraining ever set for the given search space (see Figure 1). From this we can draw conclusions on the maximum deformation that neutron stars at the Galactic Center area may have, the ellipticity (see Figure 2). So, even without a detection we can retrieve valuable information about the possible sources at the Galactic Center.

Figure 2. The plot shows, similar to the plot above, the 90% confidence upper limits on the ellipticity for our target population of sources. The ellipticity is a measure of the deformation of the star. These values are directly computed from the upper limits on the gravitational wave strength. We can conclude that the neutron stars located at the Galactic Center (at a distance of 8.3 kpc = 27072 light years) have to have smaller ellipticities than the values shown here. Since the ellipticity is also dependent on the moment of inertia of the emitting source which is quite uncertain, we present these limits for three different values of the moment of inertia. The three values are expressed in terms of the fiducial value which is Ifid = 1038 kg m2.

