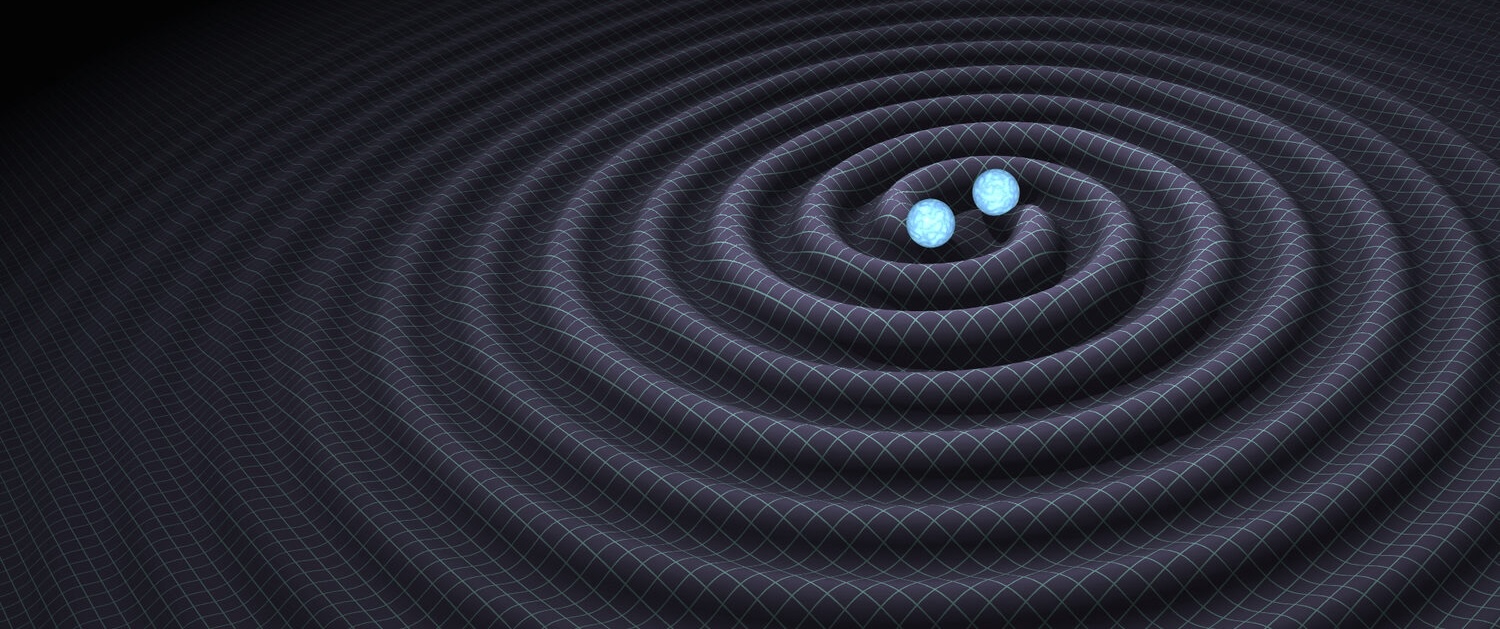
On 17 August 2017, at 12:41:04 UTC (8:41:04am EDT in North America, and 2:41:04pm CEST in Europe) the LIGO-Virgo gravitational wave detector network registered a gravitational wave signal from the inspiral of two compact stellar remnants known as “neutron stars.” This event came just three days after the first joint LIGO-Virgo detection of a binary black hole merger, GW170814 (see that science summary).
GW astronomers have been expecting gravitational wave signals from the merger of binary neutron stars because neutron stars are common in the Universe, and because we have detected binary neutron stars before using radio telescopes. The most famous example is the Hulse-Taylor binary pulsar, discovered in 1974. Radio astronomers have been plotting its orbit for 40 years now, and shown that the two stars are slowly spiralling together. In approximately 300 million years, the Hulse-Taylor binary pulsar will merge, creating a signal similar to the one LIGO just observed for GW170817.
The detector network was in the second “observing run” (called O2) — the two LIGO detectors had started on 30 Nov 2016, and Virgo had just joined on 1 August 2017. Multiple detectors allow gravitational wave astronomers to measure where on the sky a signal comes from; the more detectors, the better they can locate the region on the sky. For this event, the localization was to an oblong region (called an “error ellipse”) roughly 2 degrees across, and 15 degrees long, covering about 28 square degrees (visually, this is roughly the size and shape of a banana, held at arms length). The area on the sky is in the constellation Hydra, centered near the naked eye star Psi Hydrae.
Other Detections: Multi-messenger Astronomy
Just 1.7 seconds after the gravitational wave network saw the signal, a gamma-ray burst known as GRB170817A was detected by Fermi-GBM. Strong signals like GW170817 or GRB170817A are often called “triggers” because they initiate other astronomy activities. In the case of this event, the gravitational wave and gamma-ray triggers generated alerts sent out to the astronomical community, sparking a follow-up campaign that resulted in many detections of the fading light from the event, located near the galaxy NGC 4993. For more details of this “multi-messenger” observing campaign, using both light and gravitational waves, see the companion Science Summary here.
Gravitational Wave Signal
Gravitational waves from a binary neutron star can be visible to a detector for a minute or more. In GW170817, about 100 seconds before the neutron stars merged they were separated by about 400 kilometers, but completed about 12 orbits every second. With every orbit, gravitational waves forced the stars closer together. As orbits shrink, the stars move faster and faster, and the strength and frequency of the gravitational waves increases. The slow shrinking of the orbit is called an inspiral, and the increase in frequency is called a chirp. The process accelerates until the stars merge and form a single remnant.
To visualize the signal, gravitational wave astronomers find it useful to look at detector data in the form of a spectrogram. This is a color image, where time runs across the horizontal axis, and the vertical axis shows the frequency of fluctuations measured in the detector (low frequencies near the bottom of the vertical axis, and high frequencies near the top). The spectrogram image of a binary neutron star chirp looks like a long thin line, initially very flat and at low frequencies, but as time goes on it begins to slope upward more and more rapidly until the bright final upsweep right before the stars merge.
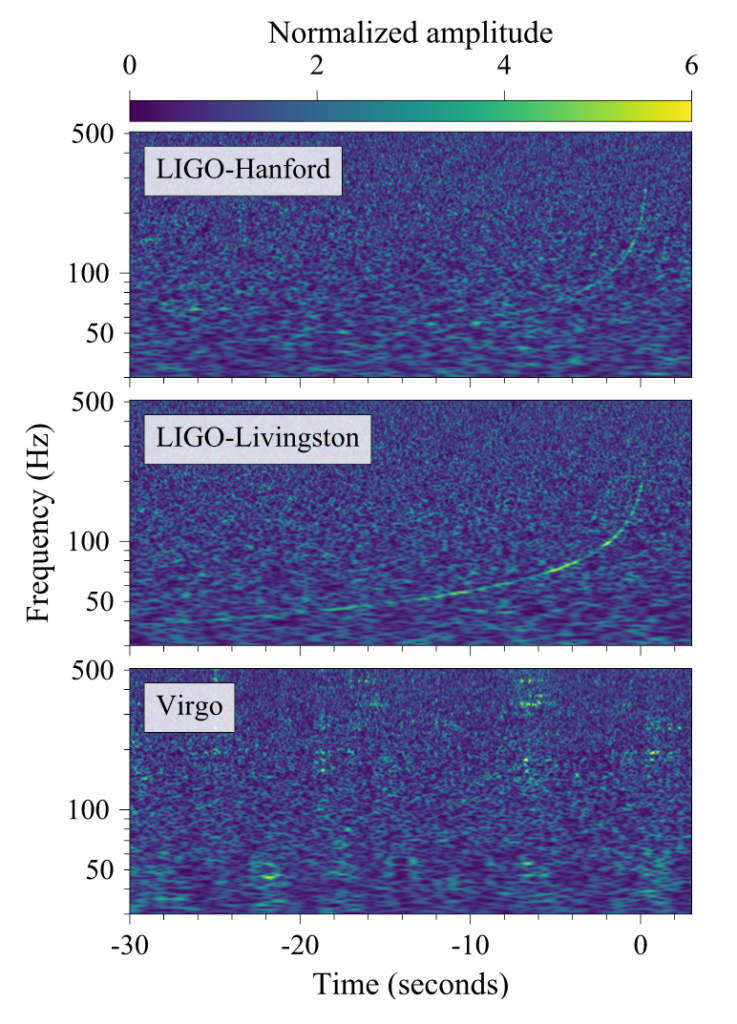
Figure 1: These figures show the spectrograms of the GW170817 signal in each of the LIGO and Virgo detectors. Time runs horizontally, and frequency runs vertically. The binary signal “chirps”, starting low on the left side, then ramping up into a steep curve on the right side. The “glitch” has been mitigated in the LIGO-Livingston spectrogram and is not seen here.
The signal is clearly visible in the spectrograms for both LIGO detectors, but not the Virgo detector. This is an important aspect of the localization on the sky. Every detector has a region of the sky where it cannot see signals as easily as in other places. Because the signal was easily visible in both LIGO detectors, but not in Virgo, the implication is that the signal came from one of the places in the sky where it was hard for Virgo at that particular moment, a fact that helps tremendously with the localization.
Glitch Cleaning
The automated software at LIGO did not initially log the signal in the Livingston data, despite the fact that the signal is visible to the human eye. The automated LIGO software did not initially generate an alert for the Livingston data, despite the fact that the signal is visible to the human eye. The problem was caused by a burst of noise — analogous to a pop of static in your stereo speakers — close to the end of the chirp of the signal. That short burst of noise is called a “glitch” by detector scientists. This glitch was loud enough to potentially affect the detector’s measurement, and an associated warning prevented any nearby triggers from being automatically registered for LIGO-Livingston. In order to correctly evaluate the properties of the signal, a careful removal procedure was used to get rid of the glitch, but not the signal.
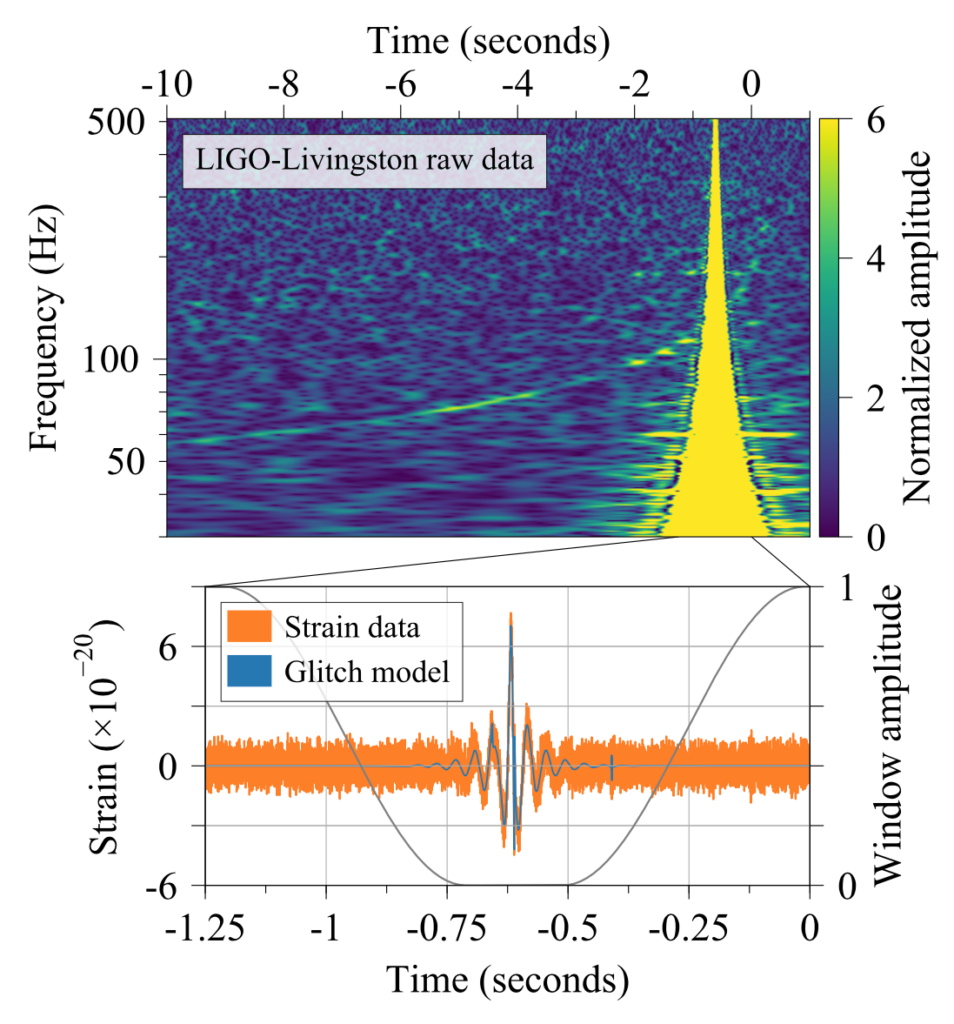
Figure 2: The top panel shows the glitch in the LIGO-Livingston data, and also clearly shows the binary chirp as well. The lower panel shows the strain (the quantity we use to describe the strength of signals in LIGO and Virgo) of the glitch in time. It is narrow (lasting only about 1/4 of a second), but very strong. Mitigation reduces the glitch to the level of the orange trace, which is the background noise that is always present in detectors like LIGO.
Glitches happen in gravitational wave detectors all the time; ones like the glitch cleaned from the GW170817 data happen once every few hours. People interested in learning more about glitches in the LIGO detectors are encouraged to visit our citizen science project, GravitySpy at gravityspy.org. In this project, citizen scientists worldwide look at spectrograms of the LIGO data and help identify and classify glitches. This information is used by LIGO team members to better understand the behaviour of the detectors and improve our analysis procedures in the future.
Properties of the Source
Every source generates a different gravitational wave signal depending on the astrophysical properties of the system. Important properties include the mass of the individual objects, how fast each one is spinning, how easy it is to squeeze or deform the object, the size of the orbit, how the orbit is tilted to our line of sight, and so on. All of these properties combine to change the overall shape, the strength, and the moment to moment changes in the gravitational wave signal. Gravitational wave astronomers measure the changes in the signal to the best of their ability, then work backwards to understand the properties of the astrophysical source.
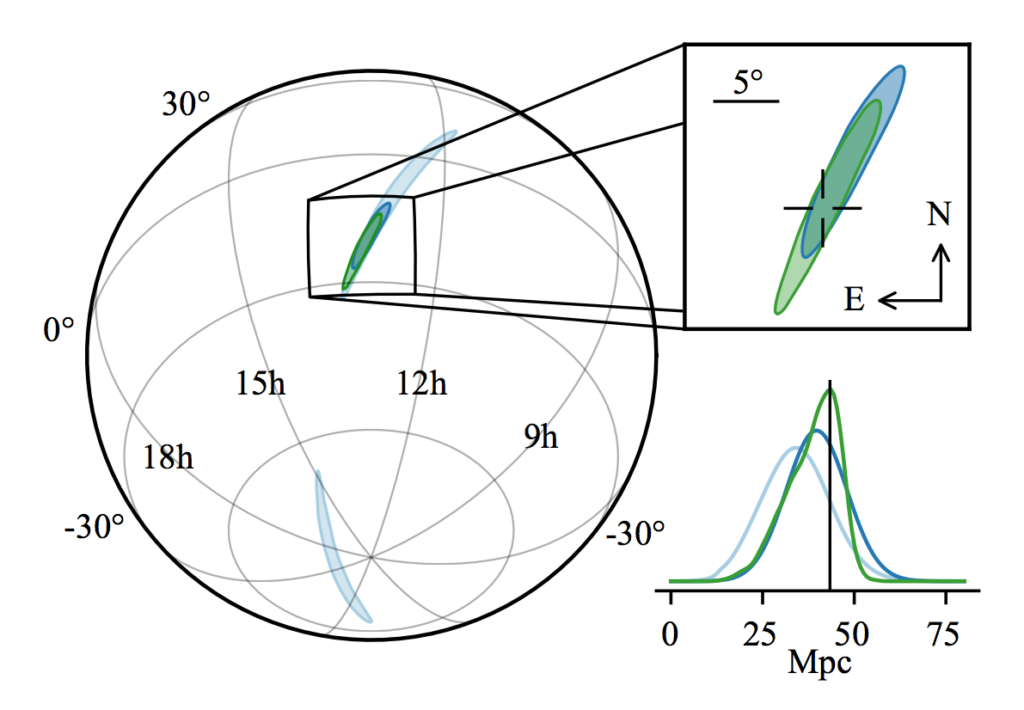
Figure 3: Spherical map of the sky, showing the location of GW170817 determined by LIGO and Virgo. The two ovals (blue and green) show the localization done by two different LIGO analysis codes. The cross-marks show the location of the galaxy NGC 4993, in the constellation Hydra. The lower left graph shows our estimate of the distance to the source from gravitational-wave data.
It is an imperfect process because the signals are not measured perfectly. The consequence is that the values we assign for the binary neutron star properties are given as a small range of numbers that describe the source comparably well (scientists often call that range of numbers “the error bars”; in the analyses used in the LIGO-Virgo collaboration the range of values comes from a distribution called “the posterior”).
The gravitational wave analysis gives a value for the masses of the individual objects in the binary to be between 0.86 and 2.26 solar masses. We can’t measure the spin tremendously well for this event, and the different spins change the signal in similar ways that having different masses change the signal. If we assume the objects are spinning slowly, then the data is equally well described by masses between 1.17 and 1.60 solar masses. In either case, these masses are consistent with the masses of all known neutron stars, which is one of the reasons we think this is a binary neutron star system.
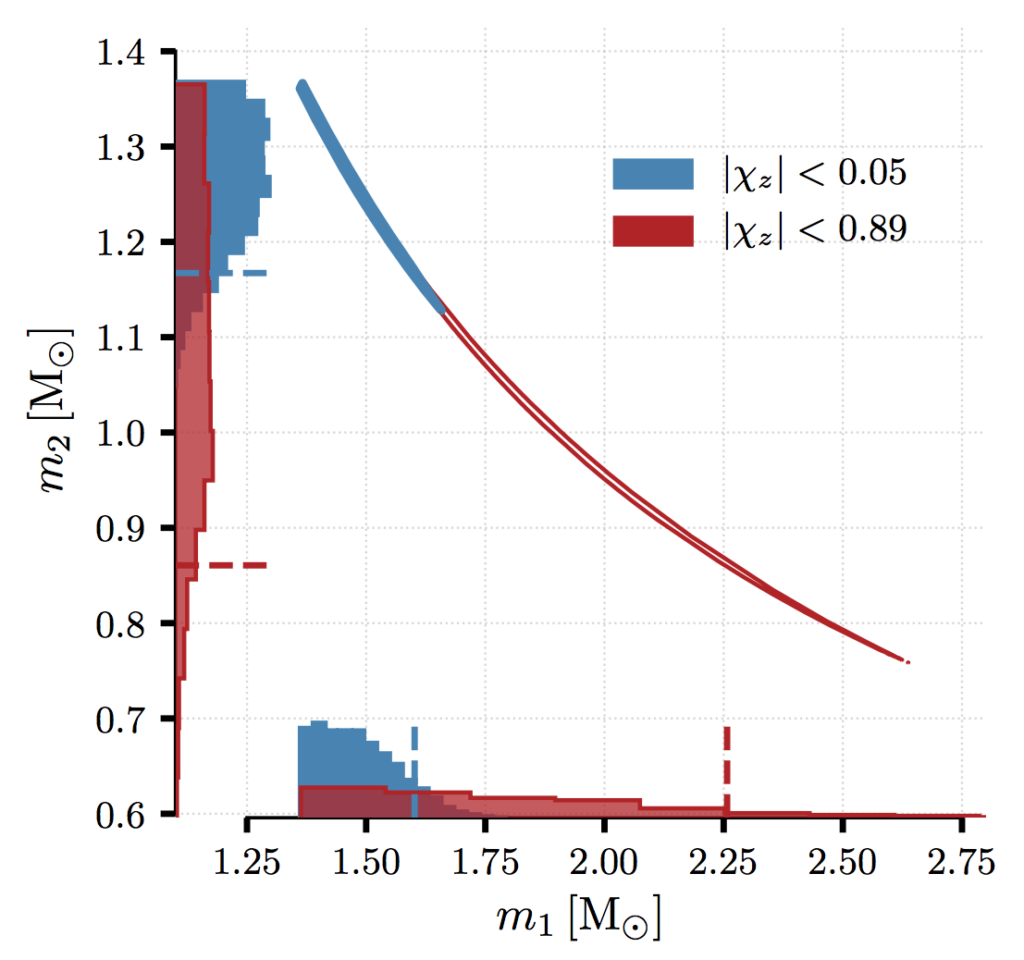
Figure 4: This shows our best estimates of the masses of the two components of the binary. Anything inside the diagonal swath are allowed. For any given point inside the contour, drawing a horizontal line to the left and a vertical line to the bottom shows the masses that correspond to that solution for the gravitational wave data. The colors indicate results for our low spin (blue) and high spin (red) cases.
Another property that can be well measured with gravitational waves is the distance to the source (or more properly in the language of astronomers, the “luminosity distance“). The luminosity distance derived from the gravitational wave signal was about 40 megaparsecs (about 130 million lightyears), and is consistent with the distance to NGC 4993. Having both the distance measurement and the optical identification of the galaxy allows us to, for the first time, conduct a joint measurement of the Hubble constant (for more details see this Science Summary).
Neutron stars are made of super-dense matter, so they don’t behave like ordinary objects you encounter on Earth. That means astrophysical observations are like a laboratory for studying super-dense matter. Physicists describe super-dense matter by a relationship called the “equation of state” that links pressure and density – similar to the more familiar “ideal gas law” PV=nRT. There are many different possible equations of state, and scientists would like to know which one best describes neutron stars. For neutron stars, the mass and equation of state determines the overall size of the star, and how its gravitational potential changes when the star is squeezed by the gravity of its nearby companion (what is called a “tidal deformation”). That in turn can change the gravitational wave signal. The analysis of GW170817 gives us some interesting limits on the tidal deformation of the neutron stars, but does not definitively tell us what the equation of state might be.
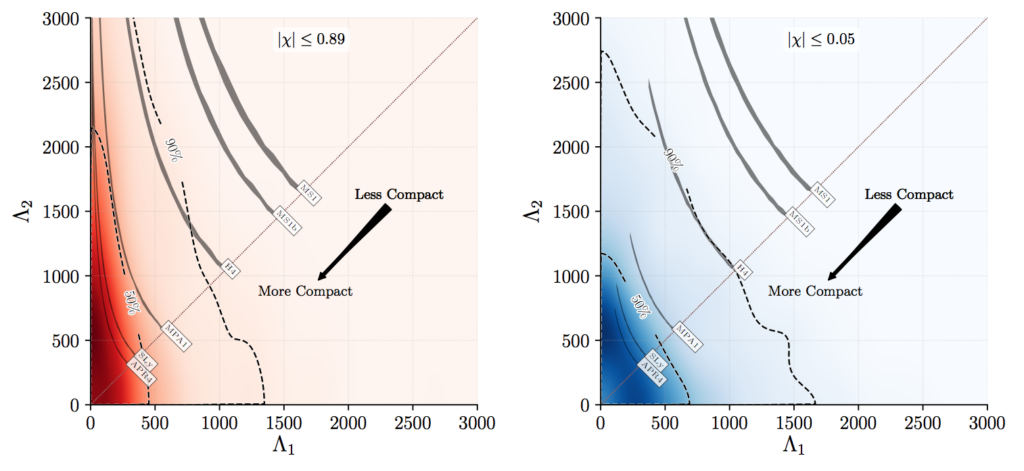
Figure 5: These figures show the “tidal deformability” of the stars. Each axis corresponds to one of the two stars, and how deformable it might be. The GW170817 system lies somewhere on this plot. The dashed lines marked 90% and 50% represent the chance the system is below and to the left of the dashed line. The high spin cases are shown on the left, and the low spin cases are shown on the right.
What else could it be?
As with all momentous discoveries in astronomy, there are many things we have learned, but there are also many unanswered questions. The two biggest questions we still have about GW170817 have to do with the nature of the objects. The associated electromagnetic signal tells us that at least one of the objects in the binary was a neutron star, but it does not mean they both were. Even though both components have masses that are similar to known neutron stars, it is possible one of them was a black hole. Astronomers have never seen a black hole with a mass similar to a neutron star, but they also have no solid observational evidence to suggest they do not exist either, so it is possible GW170817 was a neutron star-black hole binary. However, given the similarity in mass to known neutron stars, we favor the interpretation that this is a binary neutron star. The other outstanding question is what did GW170817 become after it merged? There are two possibilities: either it became a very massive neutron star (it would be the largest neutron star known), or it became a black hole (it would be the lightest black hole known). Both possibilities are tantalizing and fascinating, but our data simply isn’t good enough to tell us one way or the other. All we know is the object, whatever it is, has a mass around 3 solar masses.
Find out more:
- Visit our websites: https://ligo.org, https://www.virgo-gw.eu
- You can read the full article, which has been accepted for publication in Physical Review Letters, here.
- Multi-messenger Observations of a Binary Neutron Star Merger
- Gravitational Waves and Gamma Rays from a Binary Neutron Star Merger: GW170817 and GRB 170817A
- A gravitational-wave standard siren measurement of the Hubble constant with GW170817
- Search for post-merger gravitational waves from the remnant of the binary neutron star merger GW170817
- Estimating the Contribution of Dynamical Ejecta in the Kilonova Associated with GW170817
- On the Progenitor of Binary Neutron Star Merger GW170817
- GW170817: Implications for the Stochastic Gravitational-Wave Background from Compact Binary Mergers
- Search for High-energy Neutrinos from Binary Neutron Star Merger GW170817 with ANTARES, IceCube, and the Pierre Auger Observatory

