Introduction
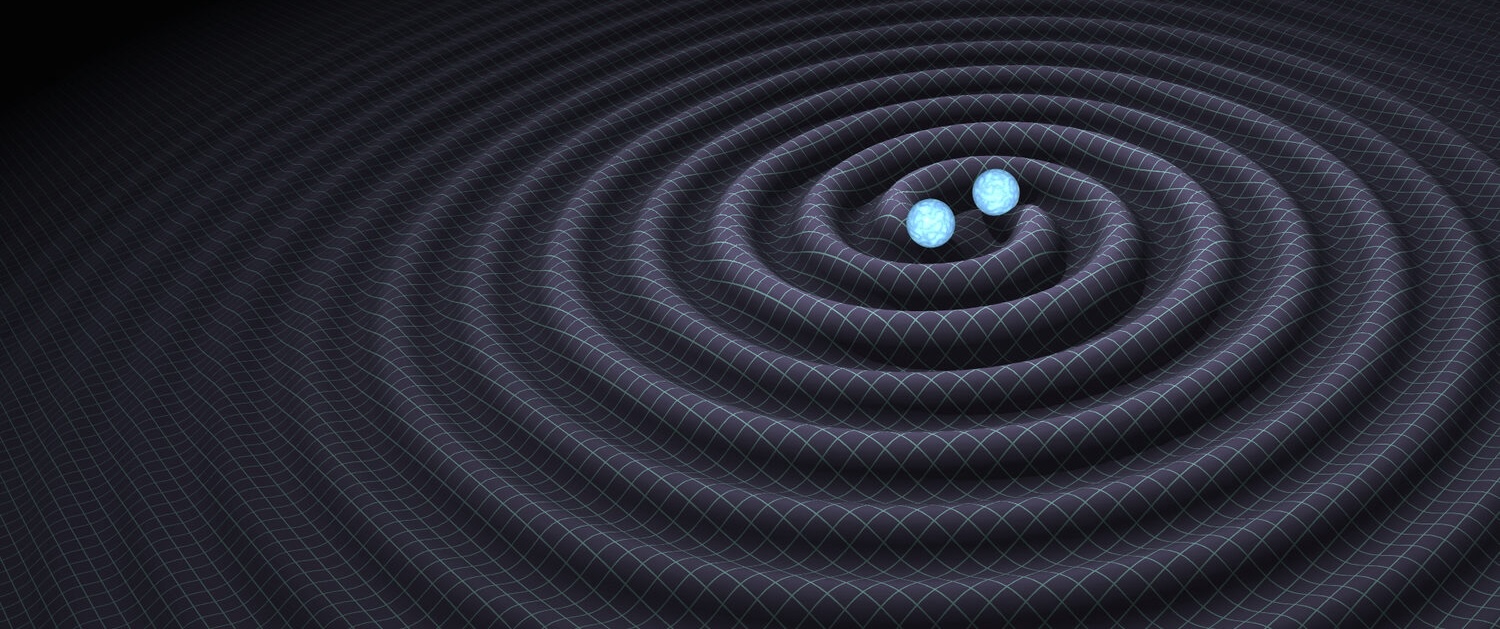
Gravitational waves are extraordinarily small ripples in the fabric of spacetime that stretch and squeeze space by a minuscule amount as they pass. The two Advanced LIGO detectors in the U.S. and the Advanced Virgo detector in Italy measure this strain, or relative change in length, by observing the interference of laser light that travels several kilometers down perpendicular interferometer arms and back.
The LIGO Scientific Collaboration (LSC) and the Virgo Collaboration release their data to the scientific community and to the public through the Gravitational Wave Open Science Center (GWOSC). The home page appears as in Fig. 1. We invite the interested readers to have a look and discover all the potentialities of the website. In this paper we provide details about the collection of the data, and their calibration and curation. We describe the structure and content of the data files released to the public. We also give pointers to software tools to ease the use of the data.

Fig. 1: Current home page of the Gravitational Wave Open Science Center website.
Everything you wanted to know about gravitational-wave data!
The detectors do not take data continuously but alternate periods of data taking with maintenance and commissioning. The periods of data taking are called observing runs (or observation runs). This paper concentrates on the first and the second observing runs, labeled O1 and O2. O1 took place between September 2015 and January 2016, and O2 took place between November 2016 and August 2017.

Fig. 2: BNS range (a number used to quantify the performance of a detector) during the first observing run (O1).
The plots that you see in Figs. 2 and 3 show the sensitivity of each detector as quantified by the BNS range, corresponding roughly to the average distance at which we can detect a specific astrophysical event, a binary neutron star merger. This is a standard way to evaluate each detector’s capabilities by monitoring how far it can “see” this very interesting class of astrophysical events. In O1 and O2, the BNS range for the LIGO detectors was around 60 to 100 mega-parsecs (Mpc). Binary black hole (BBH) mergers typically produce much “louder” gravitational wave signals, and the BBH range for the LIGO detectors can be ten times further than our BNS range. LIGO and Virgo made significant detections of one BNS and 10 BBH mergers in O1 and O2; these are compiled in the catalog GWTC-1: see the scientific paper, the science summary, and the open data release. LIGO and Virgo also search for gravitational waves from other sources.

Fig. 3: BNS range (a number used to quantify the performance of a detector) during the second observing run (O2).
A detailed calibration procedure is needed to convert the detector output to dimensionless strain, which is the main data product contained in the GWOSC files. The strain time series include both detector noise and any astrophysical signal that might be present. It is only calibrated in the frequency range between 10 Hz and 5000 Hz. Any apparent signal outside this range cannot be trusted because it is not a faithful representation of the gravitational wave strain at those frequencies.
One of the complications in the analysis of the gravitational wave data is that the noise properties vary with time and frequency. The noise contribution rises steeply at high and low frequencies. For this reason usually the observational window that we take into account goes from tens of Hz to few thousand of Hz. In addition, the data also contain transient noise artifacts, called glitches, that can mask or mimic the gravitational wave signals.
To check the ability of our detection pipelines to detect gravitational wave signals, and to test and calibrate the detectors, we inject simulated gravitational wave signals (“hardware injections”) at known times. Of course we keep careful records of these injections to avoid any confusion with real events.
Gravitational Wave Open Science Center
The Gravitational Wave Open Science Center can be reached on the web at https://www.gwosc.org. In Fig. 1 you can see a screenshot of the current home page. The interested reader is encouraged to explore the information available on this site by clicking on the menus near the top left of the page.
The gravitational-wave open data can be obtained from this website in different file formats. The main content of the files is the strain time-series; they also contain information about the data quality and any hardware injections.
Along with basic information about the data and the detectors, the GWOSC website contains useful tutorials, software, and tools such as Timeline that provides a visual overview of the available data segments over a time interval, together with the related information about data quality and the presence of injections. In Fig. 4 you can see an example of the Timeline visualization for the three interferometers during the second observing run (O2). The data in these plots can be downloaded in several different formats.

Fig. 4: Example of the Timeline display for the data taken during the second observing run by the two Advanced LIGO detectors, Hanford (H1) and Livingston (L1), and Virgo (V1). The vertical axis indicates the fraction of time data are present in each bin of the histogram.
From the GWOSC contact page, users can sign up with the Users’ Group to be informed of progress, contact the GWOSC team for questions or comments, and find more general information about LIGO and Virgo.
Find out more:
- Visit our websites: ligo.org, www.virgo-gw.eu
- The Gravitational Wave Open Science Center: gwosc.org
- Details about the strain data, calibration, data quality, hardware injections, and more: https://www.gwosc.org/yellow_box/
- GWOSC tutorials page: https://www.gwosc.org/tutorials/
This includes links to our Gravitational Wave Open Data workshop web courses. - freely available preprint of the scientific paper on arXiv.org that describes the O1 and O2 open data set

