Using data taken between November 2005 and September 2007, the Laser Interferometer Gravitational-wave Observatory (LIGO) Scientific Collaboration and the Virgo Collaboration have placed upper limits on the amplitude of the stochastic gravitational wave background.
The stochastic gravitational wave background is expected to arise from a combination of sources across the sky that are too faint to observe individually. There are several sources that are expected to contribute to the gravitational wave background, including the combined emission of all the spinning neutron stars and neutron star binary mergers in the universe. Neutron stars are very old stars which have burned all of their nuclear fuel and have collapsed under their own gravity until they are as dense as an atomic nucleus. We also expect a contribution from the Big Bang itself. It is thought that quantum fluctuations in the fabric of spacetime created gravitational waves during the first moments after the Big Bang, these gravitational waves would still be visible today as part of the gracitational wave background.
Scientists used the data from LIGO’s fifth science run and Virgo’s first science run to search for the combined stochastic gravitational wave background from the whole sky. This is the first time data from both LIGO and Virgo have been used to search for such a signal. The inclusion of Virgo data allows an improvement of the sensitivity across the frequency band. The data from the LIGO and Virgo interferometers were combined to estimate the amplitude of the gravitational wave background. No signal was seen, so the data were used to place upper limits on the amplitude.

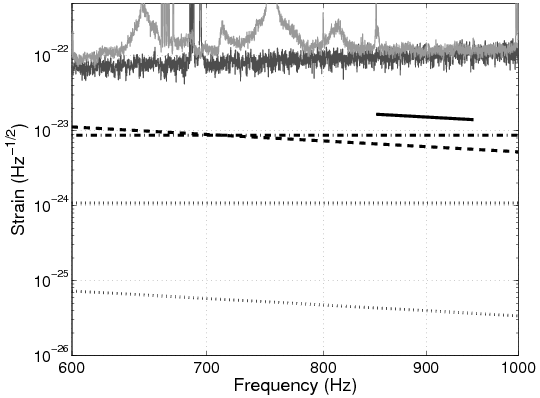
Figure 1: Upper limits on the gravitational wave strain associated with a stochastic gravitational wave background, as a function of gravitational wave frequency. The dark grey line shows the average strain sensitivity of the LIGO Hanford interferometer during the fifth science run, while the light grey line shows the average strain sensitivity of the Virgo interferometer during its first science run. The dashed and dashed-dotted lines show the upper limits obtained by this analysis for two different models of the gravitational wave background. The dashed-line model assumes that the gravitational-wave energy density is constant across the observation band while the dash-dotted model assumes that the gravitational-wave strain is constant across the observation band. For comparison we have also plotted some previous results — the solid black line is the previous most sensitive upper limit in this frequency band obtained by the analysis of data from the LIGO Livingston interferometer and the Allegro bar detector. The dotted lines are extrapolated from the most sensitive limit at a lower freqeuncy, obtained by the analysis of LIGO data during S5 in a frequency range of 40-500 Hz. A strain of 10-23 corresponds to movement of LIGO’s mirrors of approximately 10-20m — one hundred thousand times smaller than the diameter of a proton.
The upper limits set by this analysis were seven times more sensitive than the previous most sensitive upper limit in this band, obtained by analysing LIGO data with data from the ALLEGRO bar detector (the results of that analysis can be seen here). The analysis also required the development of a new method of combining the data from multiple interferometers, correctly accounting for uncertainty in the calibration of the instruments. This new method will be useful when analysing the data from Advanced LIGO and Advanced Virgo, which are expected to become fully operational in 2014-15.

