Observing astronomical events with both light and gravitational waves will tell us more about the cause of the events than either observation would alone. In order to take advantage of this potential, LIGO and Virgo have established partnerships with scientists who operate telescopes around the world and developed the systems needed to quickly analyze gravitational wave data and send alerts to the telescopes. A recent publication, which is summarized below, details the benefits of following-up on possible gravitational wave events with light observations, the partnerships formed, the analysis methods used, and the potential light observability of a candidate gravitational wave detection.
Because gravitational waves are created by the acceleration of matter, they carry information about the motion of matter in the event’s system. However, observing gravitational waves alone can currently only localize their source from tens to hundreds of square degrees of area on the sky (5 full moons fill about 1 square degree). Detecting a new source of light in this area of the sky would improve the source localization to a much higher precision and allow the measurement of the light’s redshift, which indicates the distance to the source. Observing both gravitational waves and light from the same source can also help us identify what causes different kinds of gamma-ray bursts or allow for the observation of certain supernovae from their earliest moments (which can only done by chance with light observations alone).
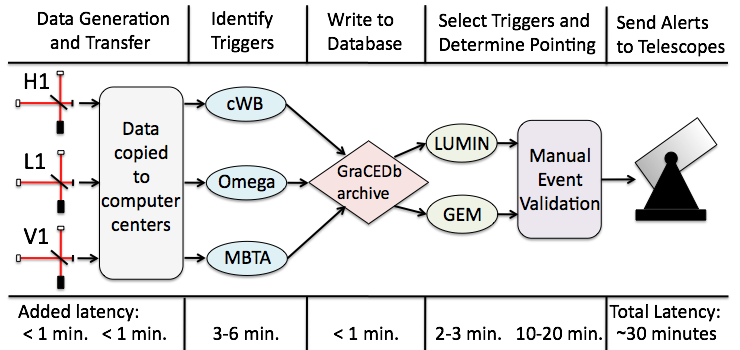
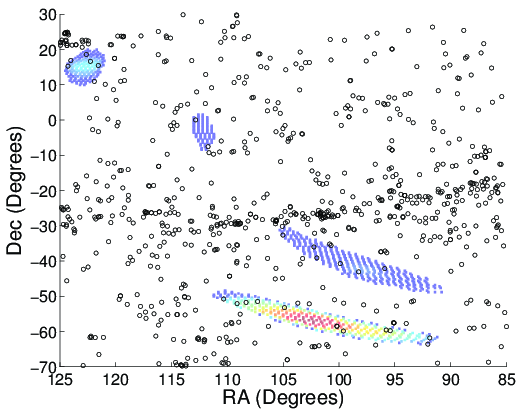
This study was performed during the 2009-2010 LIGO-Virgo joint run and used three gravitational wave data analysis methods: two to detect bursts and another to detect compact binary inspirals. These methods measured both the strength of a candidate detection and estimated areas on the sky where the signal most likely originated. If the event was strong enough to have a low false alarm probability, the source information was then processed through software that produced observing plans for the partner telescopes. These observing plans suggested the best areas to observe based on where galaxies were located, how much area each could observe and how many pointings (images) they allowed. The event, observing plan and state of the detectors were then reviewed by on-call experts before being sent to the telescopes for observation.

A flowchart of the rapid analysis with approximate time requirements for each stage. Data and information on the data quality were generated at the Hanford, Livingston, and Virgo detectors (H1, L1, V1) and copied to centralized computer centers. Three data analysis programs identified triggers which were written to a common database. The most promising triggers were selected and, after a manual validation step, “alert” messages with the sky coordinates of the prospective signal were sent to several telescopes for imaging.
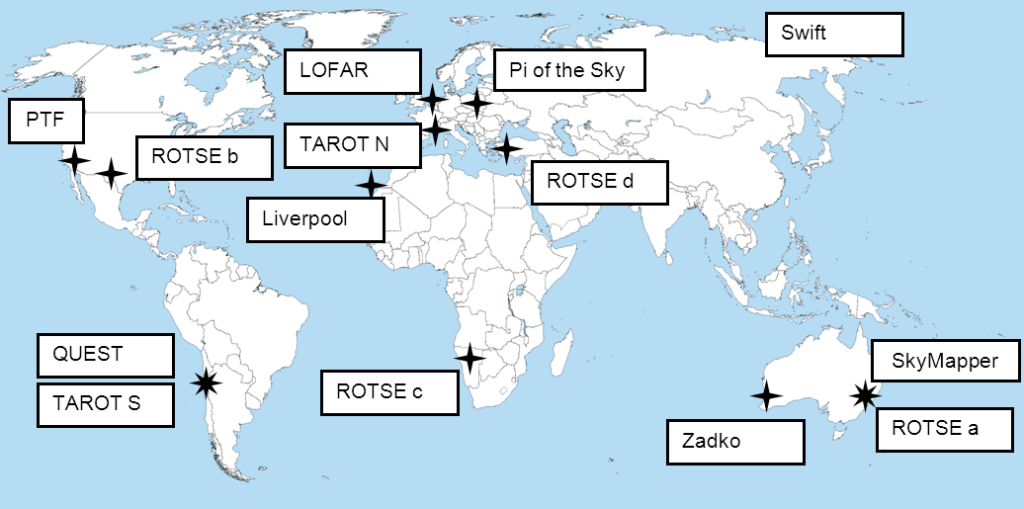
Because of the large area produced in the gravitational wave source localization, most of the partner telescopes were ones that observed large areas of the sky (wide-field) in optical light including the Palomar Transient Factory, Pi of the Sky, QUEST, ROTSE III, SkyMapper, and TAROT. Optical telescopes with narrower fields of view included the Zadko Telescope and the Liverpool Telescope. The LOFAR observatory observed large areas of the sky in radio waves and the Swift satellite observed narrower fields in both X-ray and UV/optical light. (Although not used in the prompt follow-up of candidate gravitational waves in this study, the Expanded Very Large Array also made radio observations within 3 to 5 weeks of some events.)

A map showing the telescopes that participated in this study. Note that Swift is actually a satellite which continuously orbits the Earth. (Image adapted from a blank world map placed in the public domain by P. Dlouhý).
Ultimately, it was shown that the rapid follow-up of candidate gravitational wave detections is feasible with candidate gravitational wave events being successfully evaluated by humans and sent out to telescopes in about a half an hour’s time. Also, it was found through simulations that the correct portion of the sky would be observed for a strong event with ~50% or greater probability with a few wide-field pointings. The results of observations made through this work will be published in the future. These findings and the experience gained from the project are now being used to plan a better, expanded follow-up campaign for when the Advanced LIGO and Advanced Virgo detectors begin operation in a few years.

Sky map calculated from the gravitational wave data, showing where a gravitational wave signal would most likely have came from if it were real (colored contours with red = highest likelihood). The locations of nearby galaxies are marked with black circles.
Read more:
- Freely readable preprint of the paper describing this work: “Implementation and testing of the first prompt search for gravitational wave transients with electromagnetic counterparts” by J. Abadie et al. (the LIGO Scientific Collaboration and the Virgo Collaboration)

