Introduction
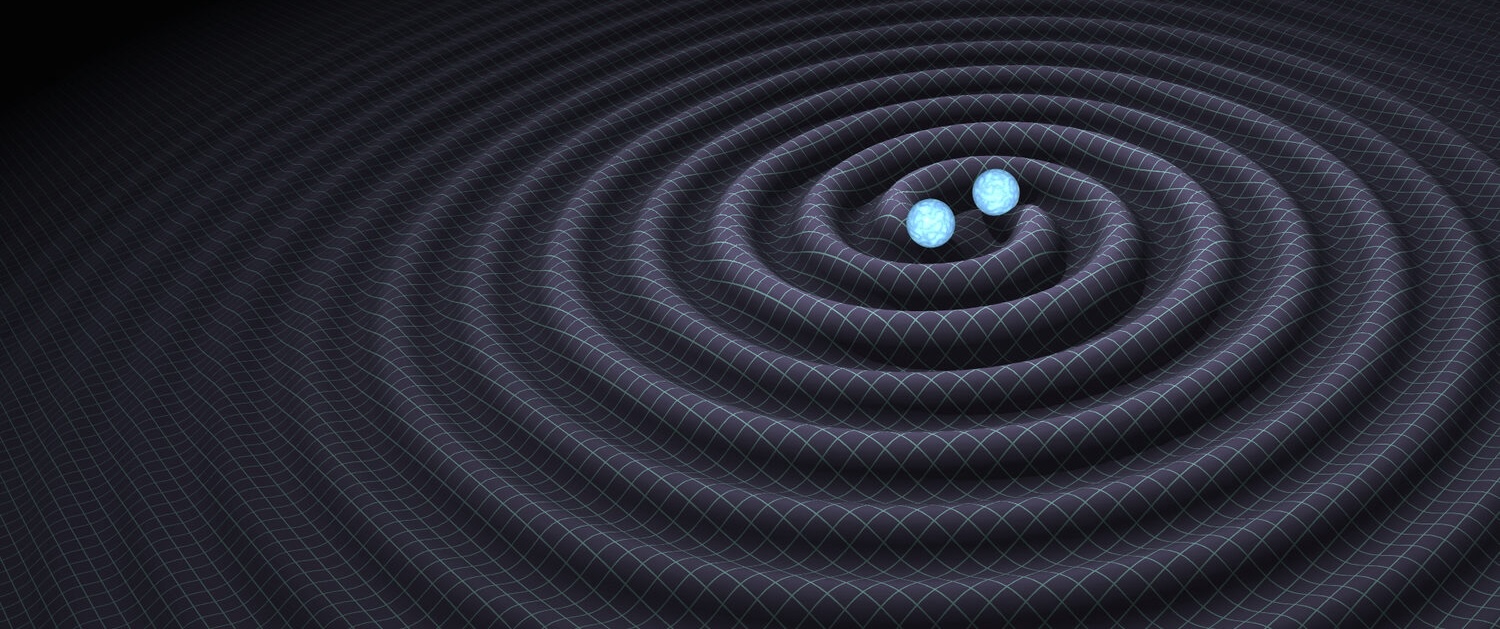
Gravitational waves are extraordinarily small ripples in the fabric of spacetime that stretch and squeeze space by a minuscule amount as they pass. The two Advanced LIGO detectors in the U.S. and the Advanced Virgo detector in Italy measure this strain, or relative change in length, by observing the interference of laser light that travels several kilometers down perpendicular interferometer arms and back. Even the loudest gravitational wave signals only produce a change in length in the LIGO and Virgo detectors that is 1,000 times smaller than the size of a proton. It is a challenging task to extract these fleeting and feeble signals from the hiss and crackle of detector noise.
With the increased interest in gravitational-wave astronomy from the wider scientific community, the LIGO Scientific Collaboration and the Virgo Collaboration have been taking steps to help facilitate participation in the analysis and interpretation of LIGO-Virgo data. Key to this effort is the publication of a new guide to LIGO-Virgo detector noise and extraction of gravitational-wave signals; the goal of this data analysis guide is to provide an accessible introduction to gravitational wave detector data, the properties of the noise, and the various data analysis methods used to detect and characterize gravitational wave signals. The examples shown in the guide use data that are available from the Gravitational Wave Open Science Center, gw-openscience.org, along with tutorials and software tools to work with the data. The LIGO and Virgo collaborations also host open data workshops offering participants a hands-on introduction to working with software tools to access and analyze open gravitational-wave data.
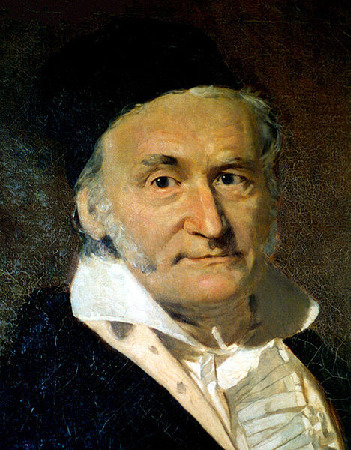
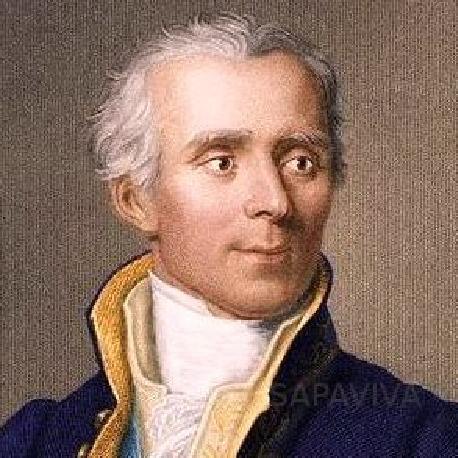
Carl Friedrich Gauss (left) and Pierre-Simon Laplace (right) laid the foundations for the LIGO/Virgo analyses over two centuries ago.
Signals and noise
The techniques used to analyze the LIGO/Virgo data have their foundations in work done over two centuries ago by the French mathematician Pierre-Simon Laplace and the German mathematician Carl Friedrich Gauss. Laplace laid the foundation for the probability theory that we use to infer properties of gravitational wave sources, such as their masses, spins and sky location. Independently, Gauss developed a method for fitting a model to observations that provided the “most likely” solution. This concept of “likelihood” is used today in the LIGO-Virgo analyses, and expresses the idea that the residual – what you get after subtracting your model from the data – should be consistent with the properties of the noise. Gauss also showed that under certain conditions the noise should be distributed as a bell-shaped curve – today called a Gaussian, or Normal distribution. Laplace expanded on Gauss’ work and showed that measurement noise will follow a bell curve whenever the noise is caused by a very large number of random disturbances.
The LIGO-Virgo data can be challenging to analyze as the noise properties vary with time and frequency, and noise transients, known as glitches, cause the statistical properties of the noise to deviate from the Gaussian ideal. The data analysis guide describes the various techniques that have been developed by LIGO-Virgo scientists to track and mitigate the effects of these noise fluctuations, and to deliver robust and reliable statements about detection significance and the properties of the astrophysical systems that generate the signals.
In the LIGO-Virgo network we have multiple detectors separated by thousands of kilometers, which is very useful when analyzing the data. It allows us to determine which direction in the sky the signals came from using differences in the arrival times at each detector. It also also plays a crucial role in separating signals from noise: gravitational wave signals produce a correlated response across the network, while the noise in each instrument should be uncorrelated. This allows signals to be distinguished from noise fluctuations.
Concerns have been raised that the first few gravitational wave events show signs of correlated noise between the detectors, but when one properly subtracts the signals, there is no evidence for statistically significant correlations in the residuals. Indeed, the residuals are found to be perfectly consistent with Gaussian noise.
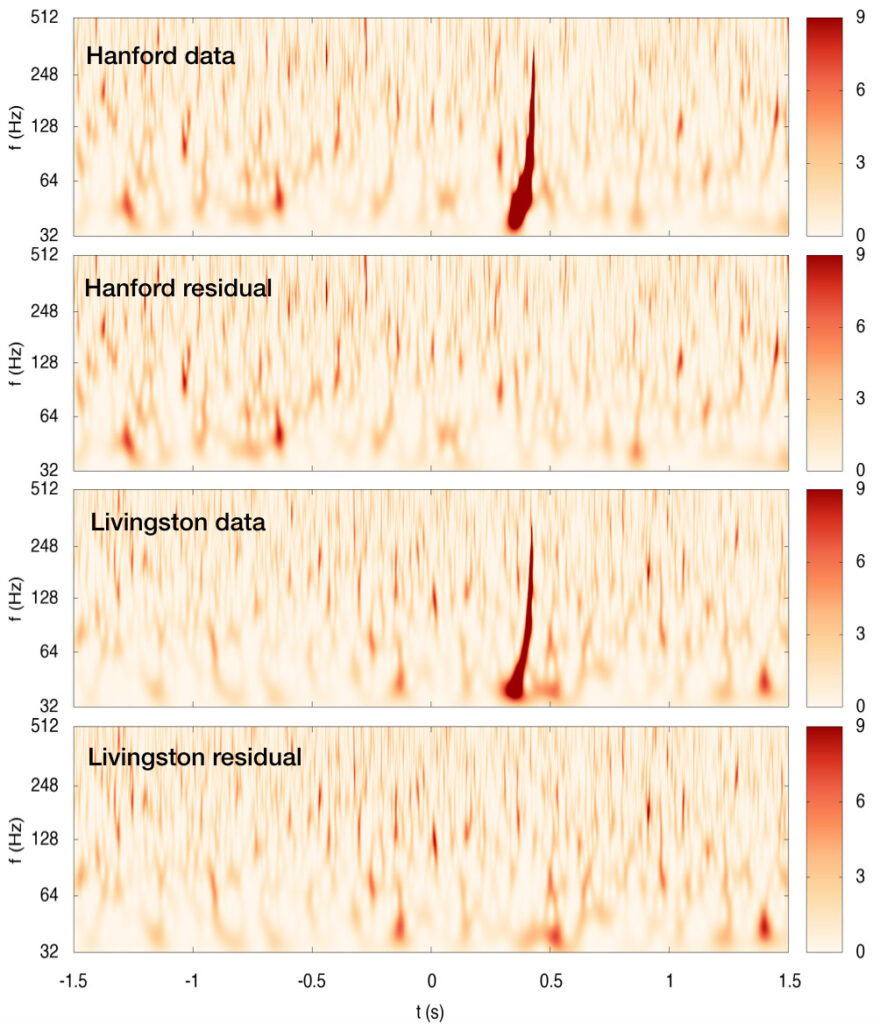
Time-frequency scans of the data in the Hanford and Livingston detectors at the time of the GW150914 gravitational wave event. Scans of the data show “comma” like regions of excess power due to the gravitational wave signal. Scans of the residual data after a best-fit model for the signal has been subtracted show no excess power. These residuals are found to be consistent with Gaussian noise.
Science Analysis
The data analysis guide covers the main steps in the LIGO-Virgo analyses: the output of the length-sensing control system is first calibrated and converted into a measure of gravitational wave strain; data quality checks are then performed to flag any corrupted data; the data is then passed to the search algorithms which identify candidate signals and rank their significance; the more promising candidates then undergo more intensive study to produce probability distributions for the properties of the source; after further vetting and data quality checks the events are added to the source catalog. The guide also describes some of the key data processing steps that are used in the analyses, such as windowing the data, converting the data to the frequency domain, estimating the power spectrum of the noise, and computing the likelihood that the data is consistent with the particular gravitational wave signal model.
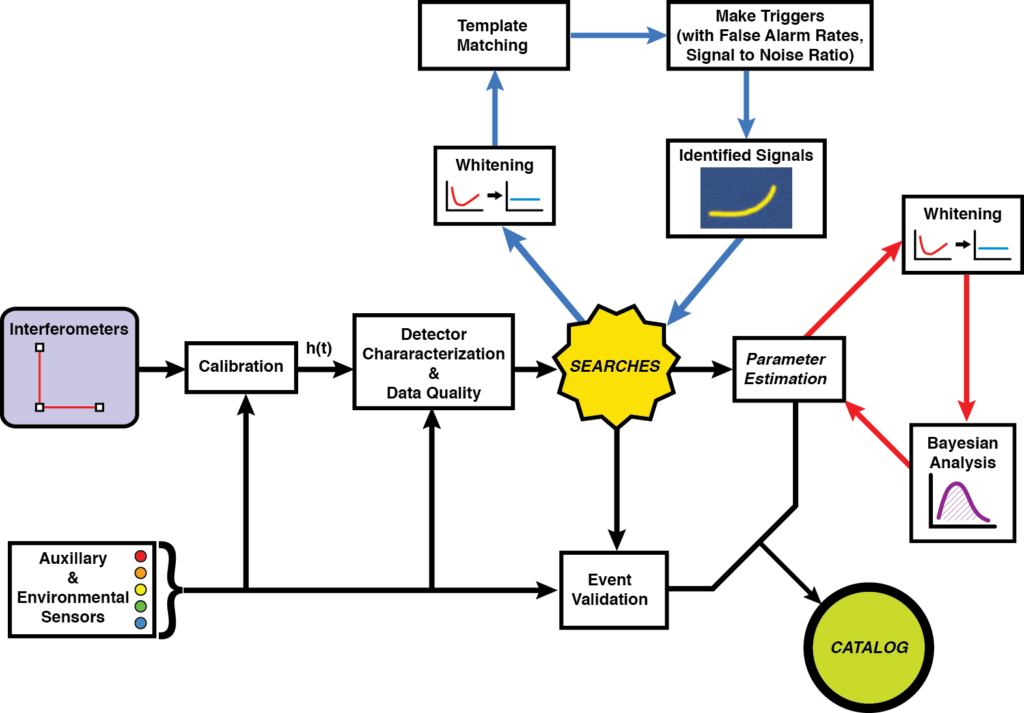
A simplified schematic showing the main steps in the LIGO/Virgo data processing.
Find out more:
- Visit our websites: ligo.org, www.virgo-gw.eu
- The Gravitational Wave Open Science Center: gw-openscience.org
- Freely available preprint of the guide paper on arXiv.org
- Published version of the guide paper (B.P. Abbott et al. 2020, Classical and Quantum Gravity 37, 055002)
- GWOSC tutorials page: https://www.gw-openscience.org/tutorials/
This includes links to our LIGO Virgo Open Data workshop web course, and codes and Jupyter notebooks relevant to our Data Analysis Guide paper.

