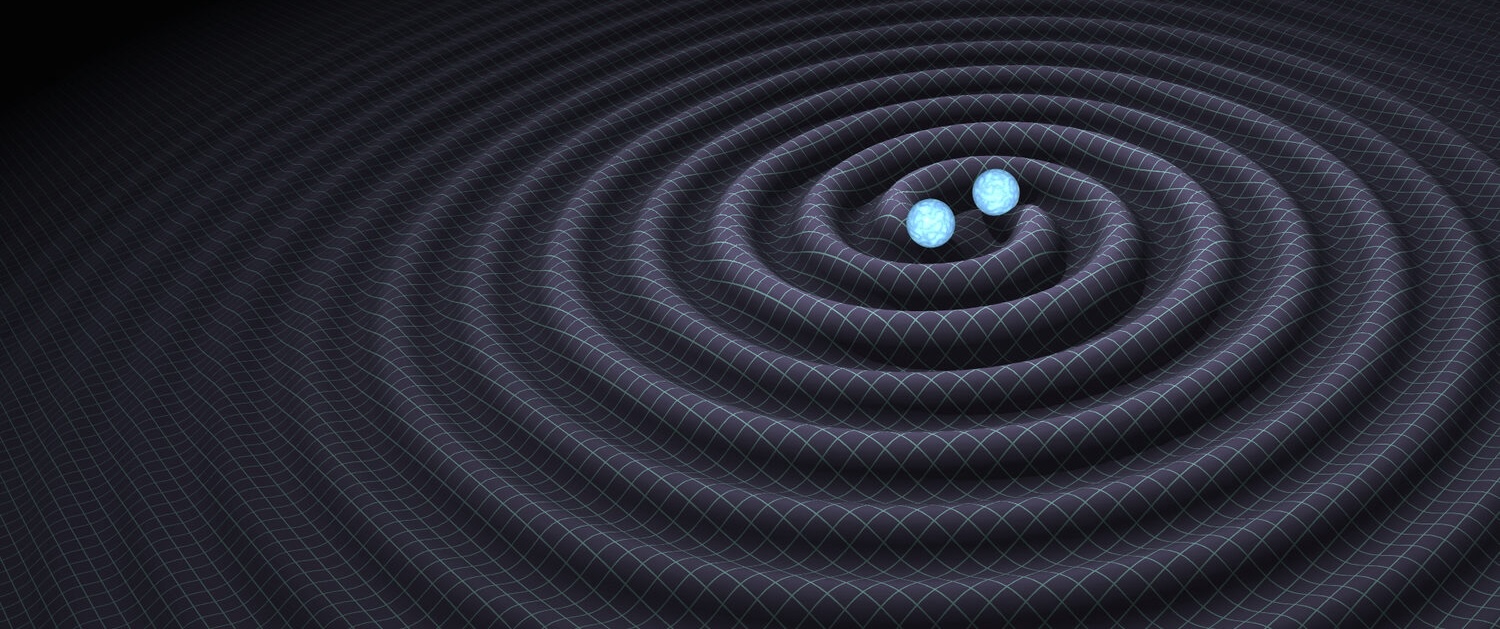
The gravitational-wave signal GW170817 was detected on August 17, 2017 by the Advanced LIGO and Virgo observatories. These observations were consistent with the source being a neutron star binary.
Neutron stars are compact objects made of matter under extreme conditions, with densities much higher than the ordinary matter we have on Earth. Astrophysical observations provide unique ways to directly probe the properties of this extremely dense matter. To describe its properties, physicists use a relationship called the “equation of state” that links pressure and density — similar to the more familiar “ideal gas law,” PV = nRT, which also involves the temperature of the gas. Since we don’t know what the equation of state is for a neutron star, there exist many different models to describe it based upon nuclear physics and astrophysics. Gravitational-wave signals can help to solve the puzzle of finding the true equation of state of neutron-star matter.
Every neutron star in a binary system will be squeezed by the gravity of its nearby companion. The amount of this squeezing, called “tidal deformation,” depends on the size and the equation of state of the neutron star and increases as the two stars spiral closer and closer together. The tidal deformation induces a change in the gravitational potential, which in turn modifies the gravitational-wave signal. Therefore, measuring the gravitational waves with LIGO and Virgo means that we can infer something about the properties of the neutron star and its matter.
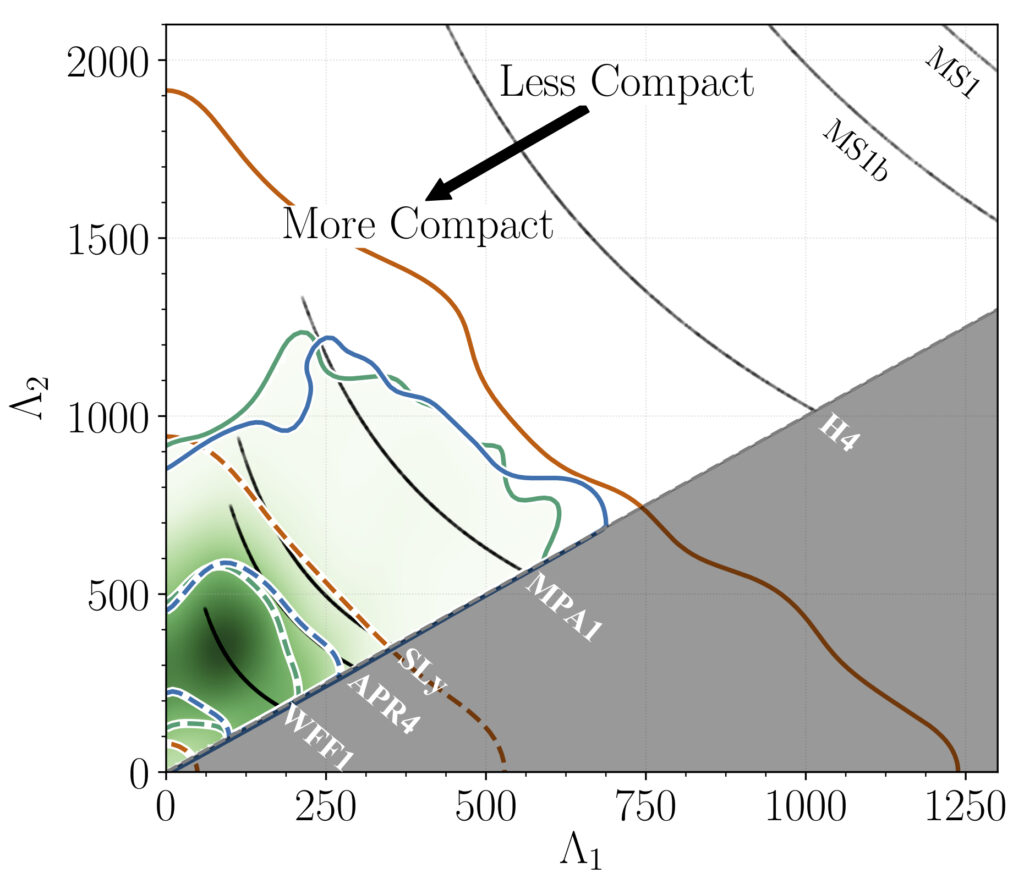
Figure 1: This figure shows the tidal deformability of the two neutron stars. Each axis corresponds to one of the two stars and shows how deformable it might be. The GW170817 system lies within the green-shaded region on this plot. The black lines indicate the predictions of some equation of state models. The dashed (solid) colored lines enclose the region where the true values of the tidal deformability lie with 50% (90%) probability. The green and blue lines refer to the two methods used in this analysis, while the orange lines refer to an analysis with fewer assumptions about the nature of the source, as described in this paper.
The first measurements of GW170817’s properties allowed us to set limits on the tidal deformation value, ruling out some equation of state models. These initial limits have recently been improved by extending the original analysis to incorporate more information, including the source location given by electromagnetic observations of the aftermath of GW170817, a more sophisticated waveform model of GW170817 accurate to lower frequencies than before, and Virgo data with improved calibration. (You can read more about our extended analysis here).
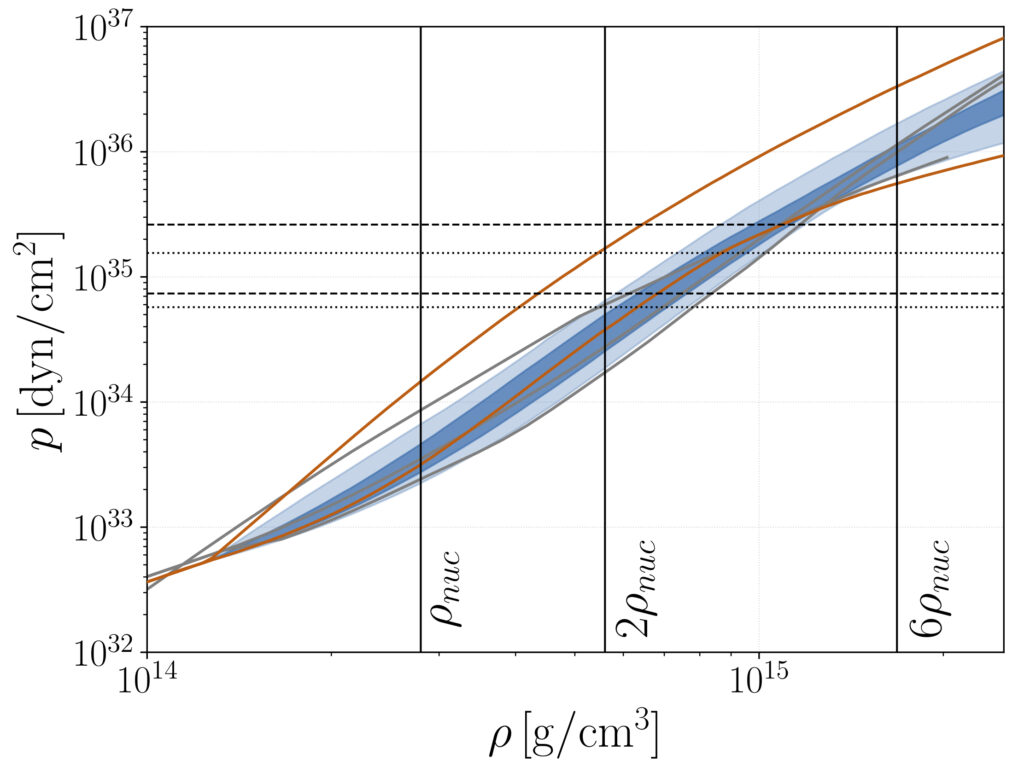
Figure 2: This figure shows the trend of the pressure (y-axis) as a function of the density (x-axis) inside the neutron stars. Our results are shown in blue: For a given density value (x-axis), the value of the pressure (y-axis) has a 50% chance to lie within the darker blue area and a 90% chance to lie within the lighter blue band. The vertical lines correspond to one, two, and six times the nuclear saturation density, i.e., the density reached when nucleons begin to touch each other. The orange lines delineate the band where the initial hypothesis on the distribution of pressure as function of density lies.
In this new paper, we discuss the results obtained if we further refine the analysis adding the hypotheses that the two neutron stars (1) have masses and spins within the range observed in other binary neutron stars within our Milky Way galaxy and (2) are both described by the same equation of state. We use two approaches to obtain our results. One method directly uses the equation-of-state relationship between the pressure inside the star and its density. The other method uses approximate formulas that relate a number of physical properties of one neutron star to those of the other. One such relationship is known to exist between each star’s “tidal deformability” (which is a specific measure of how much the star would deform in response to the tidal gravitational field of its binary companion) and its compactness; another links the tidal deformabilities of the two stars as a function of the ratio of their masses. These relations are not sensitive to the equation of state that describes the star, which allows us to estimate the size of the neutron star from its tidal deformability.
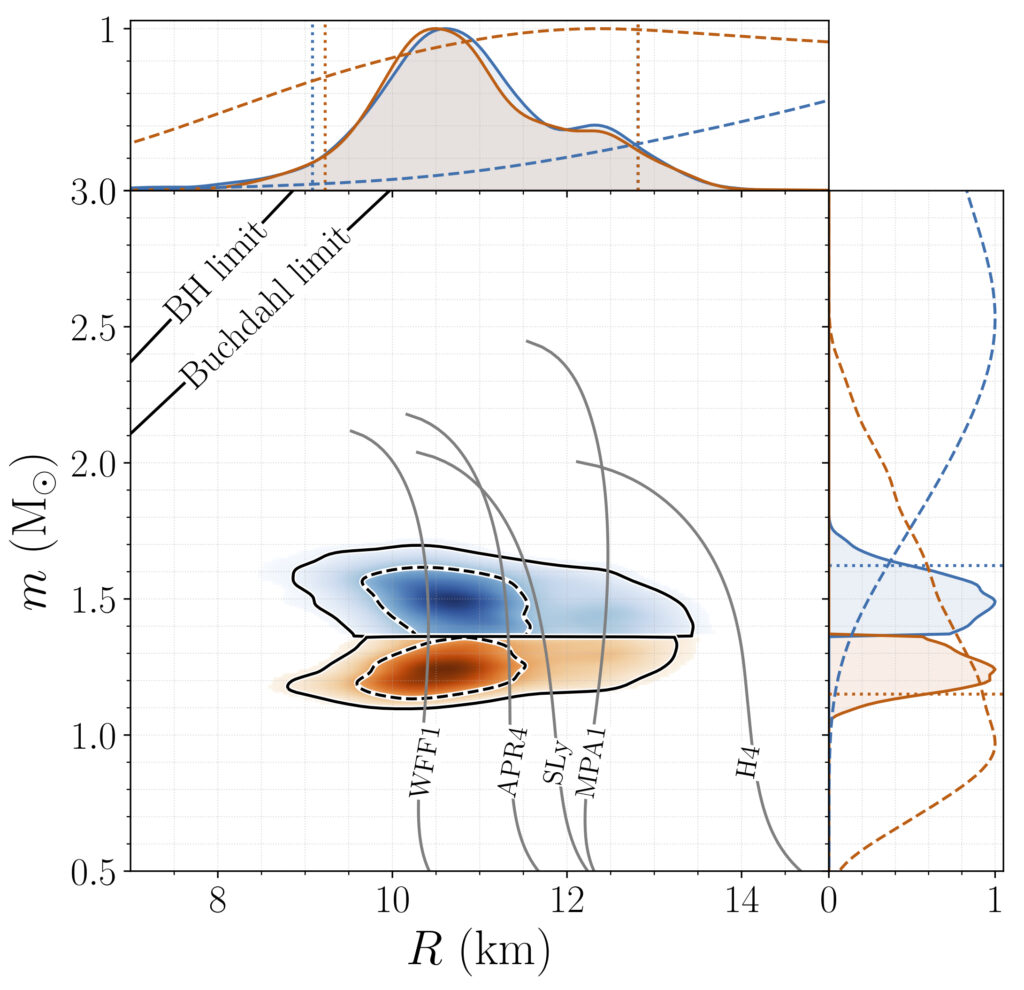
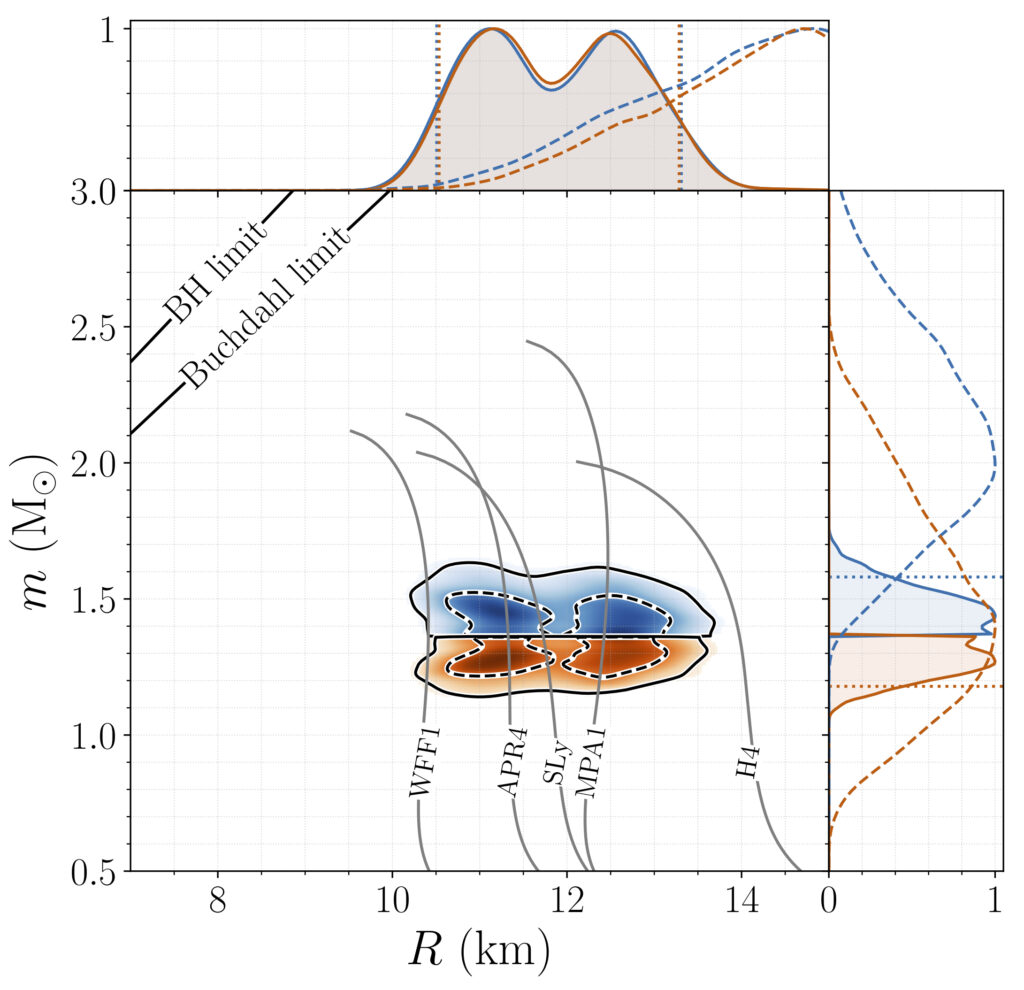
Figure 3: These figures show the mass (y-axis) as a function of the radius (x-axis) of the neutron stars. In each two-dimensional plot, the top blue area refers to the heavier star, while the bottom orange area refers to the lighter star. The areas inside the dashed (solid) lines indicate where there is a 50% (90%) chance of finding the parameters. The upper and lower plots are produced using two different methods. For the upper plot, approximate formulas are used to relate a number of macroscopic properties of each neutron star to those of the other star. For the lower plot, the relationship between the pressure inside the star and its density is used, with the additional constraint that the maximum allowed mass of the neutron star is at least as high as previously measured neutron star masses. Example mass-radius curves for selected equations of state are overplotted in gray. The lines in the top left denote the Schwarzschild black hole limit (R = 2m) and the Buchdahl limit (R = 9m/4). In the accompanying one-dimensional plots, the solid lines show projections onto one axis of the two-dimensional probability plots, while the dashed lines show the initial (prior) hypotheses on the parameters.
With this more sophisticated analysis, we improve our measurements of the tidal deformability and find the radius of each neutron star must be between 10.5 to 13.3 km. We also place limits on the pressure of the matter inside the neutron stars, where the density is higher than the “nuclear saturation density.”
Find out more:
- Visit our websites: http://ligo.org, http://www.virgo-gw.eu
- Link to the preprint of the paper describing the details of the full analysis and results.
Read more of our papers about the GW170817 discovery:
- GW170817: Observation of Gravitational Waves from a Binary Neutron Star Inspiral
- Multi-messenger Observations of a Binary Neutron Star Merger
- Gravitational Waves and Gamma-rays from a Binary Neutron Star Merger: GW170817 and GRB 170817A
- A Gravitational-wave Standard Siren Measurement of the Hubble Constant
- Search for Post-merger Gravitational Waves from the Remnant of the Binary Neutron Star Merger GW170817
- Estimating the Contribution of Dynamical Ejecta in the Kilonova Associated with GW170817
- On the Progenitor of Binary Neutron Star Merger GW170817
- GW170817: Implications for the Stochastic Gravitational-Wave Background from Compact Binary Coalescences
- Search for High-energy Neutrinos from Binary Neutron Star Merger GW170817 with ANTARES, IceCube, and the Pierre Auger Observatory

