Since the first gravitational wave detection, of the binary black-hole merger GW150914, the LIGO-Virgo detector network has observed gravitational waves from many binary black hole mergers and a couple of binary neutron star mergers. However, these events represent only a small fraction of the total number of binary black hole and binary neutron star mergers happening in the universe. Because of the current sensitivity of our detectors, we are not able to individually resolve each weak, far-away merger signal. However, the combination of these weak merger signals gives rise to a gravitational-wave background, which may be detectable using a network of gravitational-wave detectors like LIGO and Virgo. We also expect gravitational-wave backgrounds from various phenomena, such as phase transitions and primordial black hole mergers, that may have occurred in the early universe. These different gravitational-wave backgrounds are expected to have a different frequency dependence, so we should be able to distinguish between them.
In a recent paper, we searched for the isotropic components of different gravitational-wave backgrounds. The isotropic component tells us how similar a gravitational-wave background is when we look in different directions of the sky. Because the universe has structures, such as galaxies and galaxy clusters, we expect sources of these weak gravitational-wave signals to preferably reside in regions of the sky that contain these structures, giving rise to anisotropies (direction-dependent features) in the observed gravitational-wave backgrounds. A gravitational-wave background is analogous to the cosmic microwave background (CMB), the initial discovery of which suggested that it is homogenous in all directions (isotropic), while detailed studies later revealed direction-dependent features (anisotropies). These anisotropies in the CMB are considered an important discovery in cosmology, and provide an explanation for the formation of galaxy clusters and other structures in the universe. We also expect to see similar direction-dependent features in the gravitational-wave backgrounds. If observed, these anisotropies could give us insights into the history of the early universe, and also explain how matter is distributed in the nearby universe.
In this paper, we cross-correlate data from two or more detectors to search for an anisotropic gravitational-wave background. Cross-correlation, where we check the similarity of data from two detectors, is one of many techniques that allows us to extract very weak signals from the noise in gravitational-wave detectors. We use gravitational-wave radiometry to look for signals from a gravitational-wave background that come from different directions in the sky. In radiometry, in order to look in a particular direction, we time-shift the data from one of the detectors and then cross-correlate it with the data from a second detector. In this method each direction in the sky corresponds to a particular time-shift of one of the detectors’ data with respect to the other.
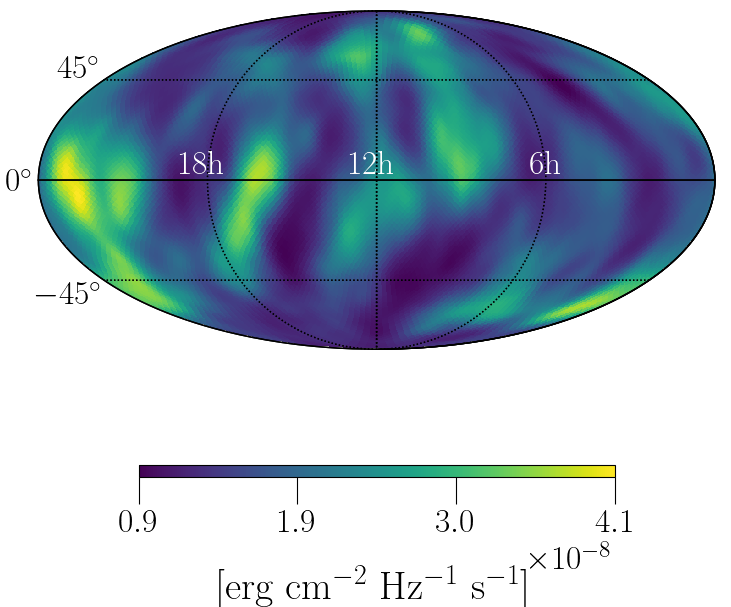
Using data from the first three observing runs of the LIGO and Virgo detectors, where the first run (O1) spanned from September 2015 to January 2016, the second run (O2) from November 2016 to August 2017 and the third run (O3) from April 2019 to March 2020, and assuming very little about the expected gravitational-wave background, we searched for broadband gravitational waves (frequencies ranging from 20 Hz – 1726 Hz) that could come from any sky direction. We did not find any significant evidence for a gravitational-wave background; hence, we set upper limits on the strength of gravitational-wave background in every direction in the sky (see Fig. 1). These upper limits correspond to maximum amplitudes of the gravitational-wave backgrounds that are still consistent with not being detected by our analysis, and can be used to constrain various models of gravitational-wave backgrounds. The upper limits obtained in our analysis are better than the previous limits by a factor ~3.

Figure 1: Sky map showing the 95% Credible Level upper limits on gravitational-wave energy flux from different directions in the sky for a signal model consisting of mergers of binary black holes and binary neutron stars. This map is in equatorial coordinates with the right ascension coordinate given in hours and the declination coordinate in degrees. An energy flux is the energy received per unit area, frequency, and time. It is given here in units of erg per centimeter squared, per Hertz, per second.
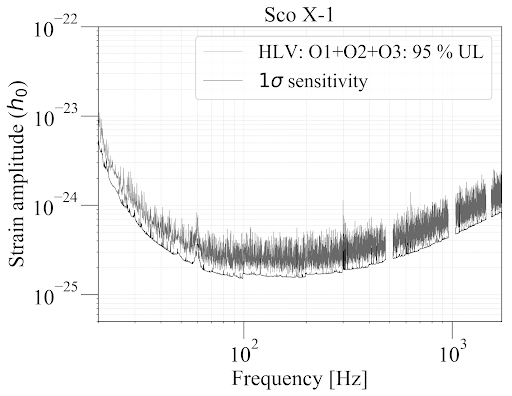
We also looked for narrowband gravitational-wave signals from three astrophysically interesting directions in the sky: supernova 1987A, Scorpius X-1 and the Galactic center. We expect these sources to emit gravitational-wave signals; however, we do not know either the expected strength, nor the frequency, of gravitational-wave signals coming from these sources. We searched for a narrowband gravitational-wave background from these sources between 20 Hz – 1726 Hz. We did not find any evidence for gravitational-wave emission, and hence placed upper limits on the possible strengths of gravitational-wave backgrounds from the above mentioned three sources (for example see Fig. 2 for upper limit on GWs from Scorpius X-1).

Figure 2: The grey curve represents the 95% credible level upper limits of the strength of narrowband gravitational-wave signals as a function of frequency for a source in the direction of Sco X-1. The black curve corresponds to the noise level of the analysis.
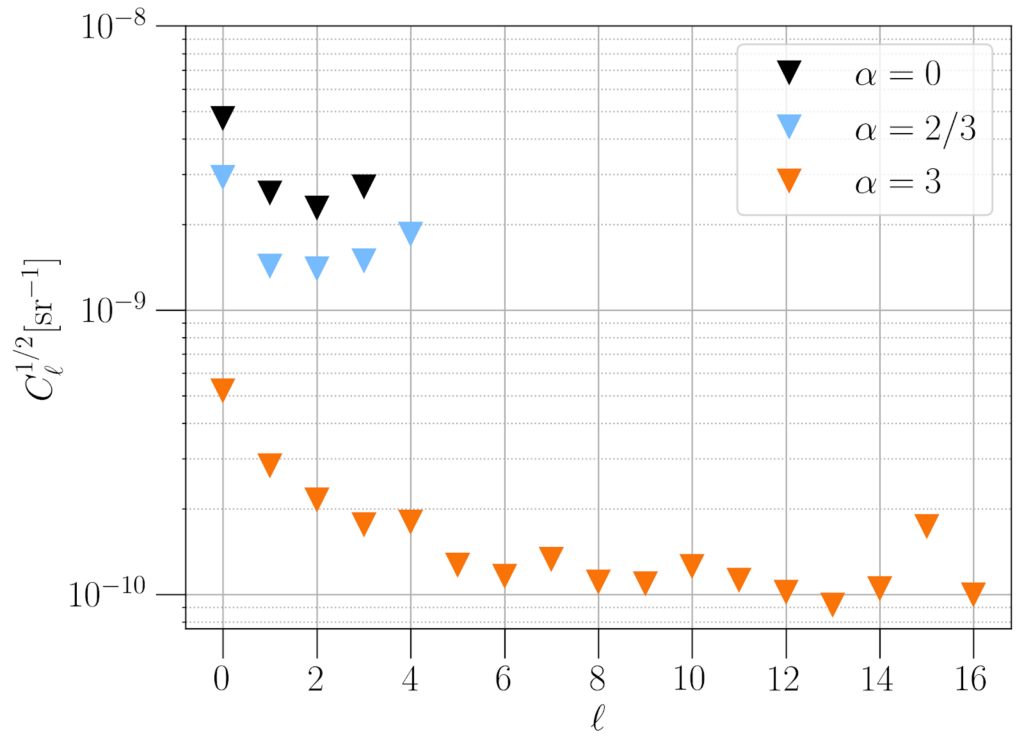
In addition to the above two searches, we also searched for different spatial patterns of gravitational-wave signals in the sky. In this search we were looking for gravitational-wave background signals from extended sources in the sky such as the Milky Way galactic plane. We did not find strong evidence for such patterns, so we set upper limits on the gravitational-wave background of various angular sizes on the sky (see Fig. 3).

Figure 3: 95% credible level upper limits on the amplitudes of gravitational-wave background of various angular sizes on the sky. The smaller the number on the horizontal axis, the larger the angular size of the gravitational-wave background on the sky. The plot shows the upper limits for three different models indicated by the different values of α corresponding to a different frequency dependence of the gravitational-wave background. For example, α=2/3 corresponds to frequency (f) dependence of f2/3.
For the analyses presented in this paper, for the first time, we have used folded data and a Python based pipeline which reduced the computational cost by more than a factor of 100. With the planned improvements to the current detectors, in the future we expect to be able to detect anisotropies in the gravitational-wave background. Similarly to the CMB, the future observation of these anisotropies could help us understand the evolution of the universe.
Find out more:
- Visit our websites:
- Read a free preprint of the full scientific article here.

