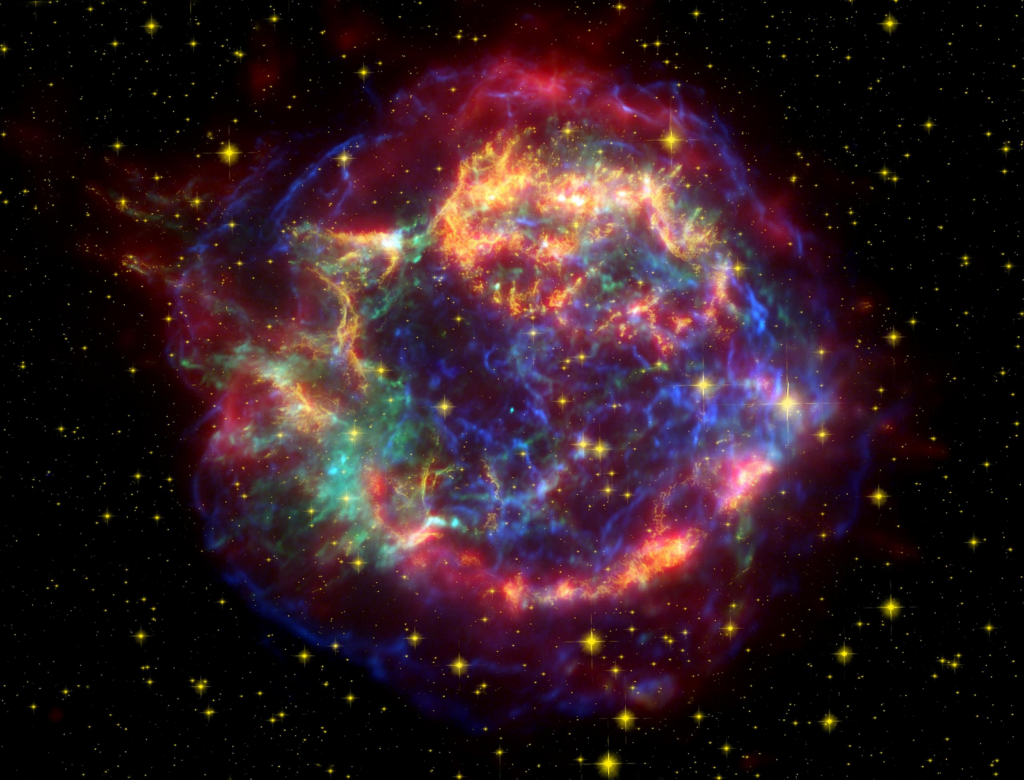
Core-collapse supernovae are the violent, explosive deaths of massive stars. The remnant of the explosion is an ultra-dense neutron star surrounded by debris from the explosion (Fig. 1). The debris from the explosion can stretch across light-years, but the neutron star in the centre is approximately 30 km (12 miles) across and has a mass about 1.4 times the mass of the Sun. Neutron stars are some of the densest objects in the universe. The composition and underlying physics of neutron stars remains one of the most tantalizing mysteries in physics, inspiring interest across a range of fields, covering astrophysics, nuclear physics, particle physics, and condensed matter physics. For the Advanced LIGO and Advanced Virgo detectors, neutron stars are important because they are likely sources of continuous gravitational waves (CWs). In a recent paper, we search for continuous gravitational waves from fifteen young supernova remnants in our galaxy using six months of data from 2019, which constitutes the first half of the third observing run of the advanced detectors, called O3a for short.

Figure 1: Cassiopeia A, one of the young supernova remnants targeted in this search. Image credit: NASA/JPL-Caltech/Krause et al.
While transient bursts of gravitational waves are now regularly observed, continuous gravitational waves continue to evade detection. This is because transient bursts are loud and short, while continuous gravitational waves are very quiet and hard to differentiate from noise. To detect CWs, we have to be patient, gathering data over a long period of time and searching for tiny but persistent fluctuations that match our signal model. For a typical search for CWs, we’re searching for waves generated by a rapidly rotating neutron star. Any deviation from a perfectly uniform star will produce gravitational waves at twice the rotation frequency of the star, with larger deviations producing a larger gravitational-wave strain (i.e. a louder signal). We call such a star “triaxial” because it’s a three dimensional ellipse, similar to a rugby ball.
There are many supernova remnants within our galaxy. We choose fifteen young supernova remnants between 100 and 10 000 years old, but for which the rotation frequency is unknown. We target young supernova remnants because young neutron stars are more likely to have non-uniform deformations than older stars. Young neutron stars also rotate faster, producing a larger gravitational wave strain. But because we do not know how fast the neutron star is rotating, we have to search a wide range of frequencies. Young neutron stars also lose rotational energy and slow down over time (spin down), so we also need to search over possible spin-down rates. Lastly, observations of isolated neutron stars with frequency measurements suggest there may be small, random fluctuations in the rotation frequency.
In a normal search (called a coherent search), we construct templates of what the signal should look like over the observation time and try to match those signals to the data. If we test the right signal template and if the number of templates isn’t too high, then a coherent search is very sensitive. But we have fifteen targets without a frequency estimate that could change their rotation frequency or undergo small, random frequency changes. In this scenario, a coherent search is too computationally intensive. We instead use three semi-coherent methods to search the early O3 data efficiently. A semi-coherent search applies a coherent search to small blocks of data and joins them together to cover the full observation time. Smaller blocks of data need less templates to search, so a semi-coherent search is much more computationally efficient. We apply three semi-coherent algorithms to early O3 data: one optimised for sensitivity, one optimised for a rapidly changing signal, and one optimised for a particular astrophysical model. None of the three searches report any CW signal.
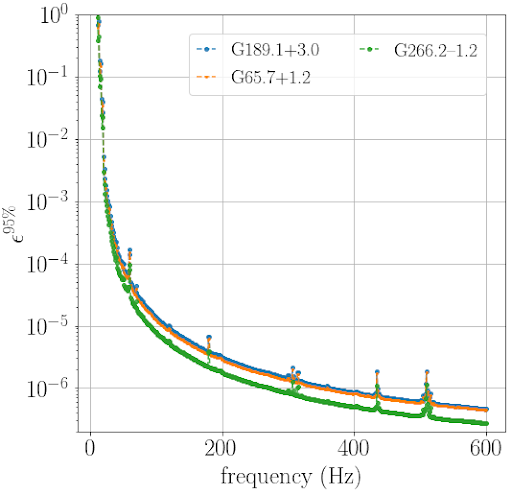
No detection, however, doesn’t mean there are no results. We can estimate the sensitivity of our search and from that infer properties about the stars we searched. A rapidly rotating neutron star emits CWs, and the more deformed a star is, the louder the signal should be. By placing a limit on the signal strength, we can put an upper limit on how deformed the target neutron star could be. The asymmetry of a neutron star is measured in the parameter ε, which stands for ellipticity. Different models for neutron stars predict different limits on the ellipticity, but most predict ε < 10-6. We show the ellipticity limits for three targets in Figure 2. The vertical axis is the 95% upper limit on ε obtained in this search. The horizontal axis is the gravitational wave frequency, which affects the ellipticity in two ways. Firstly, the gravitational wave strain at a given frequency is louder for a more elliptical star. Secondly, LIGO’s and Virgo’s sensitivity is frequency-dependent, so our limits on the gravitational wave strain vary across the full frequency range. We manage to constrain the ellipticity below the theoretical maximum (ε < 10-6). As this limit improves, we will be able to rule out physical models trying to predict neutron star properties.

Figure 2: The 95% upper limits on neutron star ellipticity ε for a few of the analyses and targets in the paper. The horizontal axis is the frequency at which we would detect a gravitational wave signal; the vertical axis is the 95% upper limit on the ellipticity. The green (G266.2-1.2), blue (G189.1+3.0), and orange (G65.7+1.2) curves show the minimum possible ellipticity we could detect. This is an upper limit on how elliptic the neutron star could be (because if it was more elliptical than this, we would have detected it!).
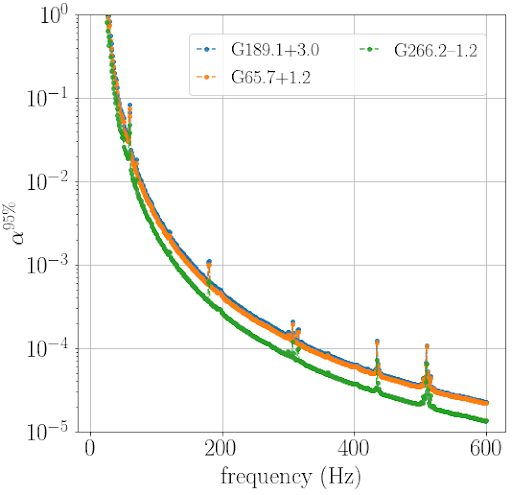
Triaxial neutron stars aren’t the only way a neutron star could generate CWs. Stellar rotation can also drive CWs through r-mode oscillations within the neutron star, with the scale of the oscillations parameterized by the amplitude α. The theoretical upper limit on the scale of the oscillations is α < 10-3. A limit on the strain from an elliptic neutron star can be converted into a limit on α, as we do in Figure 3. The vertical axis is our 95% confidence limit on α and the horizontal axis is the gravitational wave frequency (in Hz). We find α < 10-3 above 150 Hz for three targets, restricting how large the r-mode amplitudes could be in these stars.

Figure 3: The 95% upper limits on r-mode oscillation amplitude α for a few of the analyses and targets in the paper. The horizontal axis is the frequency at which we would detect a gravitational wave signal; the vertical axis is the 95% upper limit on the amplitude. The green (G266.2-1.2), blue (G189.1+3.0), and orange (G65.7+1.2) curves show the minimum possible amplitude we could detect. This is an upper limit on how strong r-modes in the neutron star could be (because if they were stronger than this, we would have observed them!).
As data collection continues and our methods improve, the probability of making the first detection increases. Until then, we constrain physical models based on non-detection and push to increase the sensitivity of our searches.
Find out more:
- Visit our websites:
- Read a free preprint of the full scientific article here or on arXiv.org.

