Introduction
The fourth observing run (O4) of the Advanced LIGO, Advanced Virgo, and KAGRA (LVK) detectors began in May 2023, and the first observation period (O4a) ended in January 2024. During this period, many gravitational-wave (GW) signals consistent with the distinct signature expected from compact binary coalescences (CBCs) were discovered. However, these binary mergers are not the only possible sources of GWs. In the study described here, we search for short-duration (less than 1 second) GW transients known as “bursts”. Potential sources of these yet-to-be detected short bursts include supernovae, pulsar glitches, as well as possible unexpected discoveries. Finding GWs from one of these sources for the first time would mark an important breakthrough.
Unmodeled searches
For CBCs, we have well understood models of how the gravitational waveforms should look, which makes it much easier to search for these signals. On the other hand, for many of the short burst source candidates like supernovae, it’s much harder to properly model how the GW should look. Because we don’t know exactly what we are seeking, we resort to “unmodeled searches”, which make minimal assumptions about the shape of the GWs. Unmodeled searches rely on finding excess power in data from multiple detectors within a narrow time coincidence window. For true astrophysical gravitational-wave events, the signal should appear in each detector.
Three searches are used in this work, and all are variants of the coherent Waveburst (cWB) algorithm. Since the last observing period (O3), these searches have been improved by incorporating machine learning to help distinguish between true astrophysical signals and detector noise.
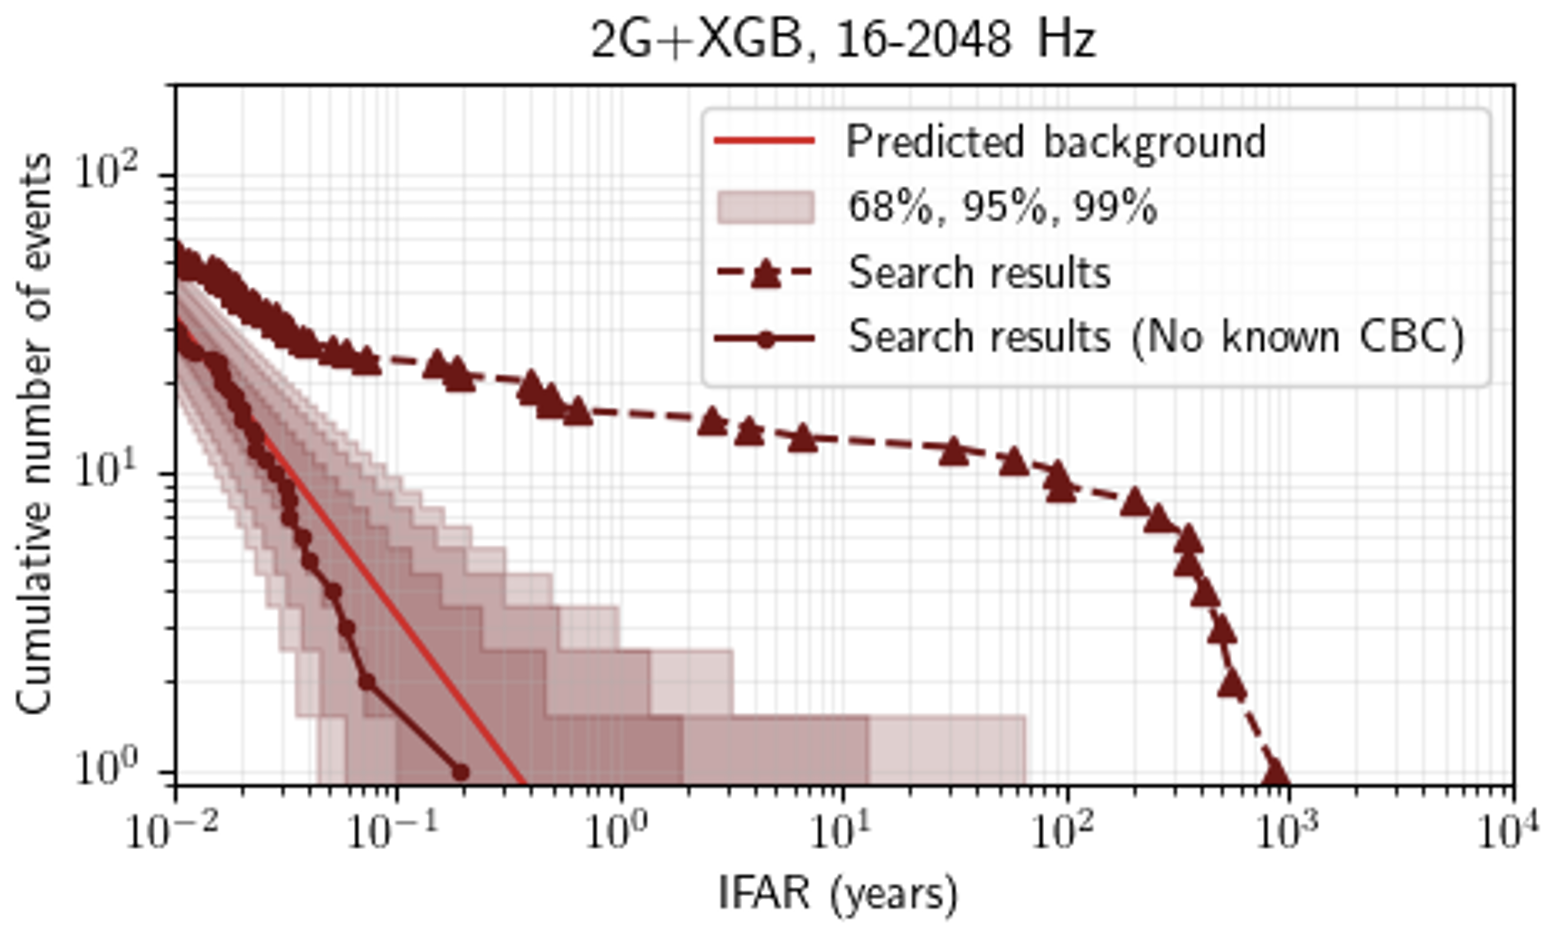
Figure 1: (Figure 3 from the paper): Search results from one of the cWB variant searches. The cumulative number of GW candidates detected by the search is plotted against the inverse false alarm rate (IFAR), a measure of the likelihood of being generated randomly by noise excesses. A larger IFAR indicates that an event is less likely to be noise. Two sets of symbols connected with lines show the total number found by the search (triangular marks) and after having discarded all known CBC sources from the data (circular marks). The solid red line represents the median number of detections caused by random noise in the data, with the shaded region representing statistical uncertainty in this value. The similarity between the predicted rate of detections due to noise (solid red line with shaded uncertainty regions) and the observed event rate once CBCs are removed (solid maroon line) indicates that no new GW bursts were found by this search. If this search had detected a GW not found by CBC searches, it would appear on the plot as a circular maroon mark to the right of the uncertainty region.
Results
Figure 1 shows the results from the search. To search for bursts, we first remove candidates found by the LVK’s dedicated searches for GWs from CBCs. Then, we can compare the distribution of candidates with the expectation from detector noise: a significant deviation would indicate a likely burst candidate detection. No short-duration burst GW candidates are found. Despite the lack of a detection, we can still characterize the search sensitivity by analyzing simulated signals. Estimating search sensitivity is useful for understanding the properties of sources we expect to detect. For example, we can rule out theories about the kinds of GWs emitted by supernovae by adding simulated supernovae GW signals to detector data and studying under what conditions the cWB searches find these artificial GWs. If a particular theoretical model predicts GWs that should be detectable with our current sensitivity, the lack of a detection in the O4a data would indicate the theoretical model is unlikely. Figure 2 shows estimated distances for which the searches would expect to detect GWs from different supernovae models. Figure 3 shows the size of a pulsar glitch that would be required for our searches to detect 50% of potential signals, using the Vela pulsar as a reference.
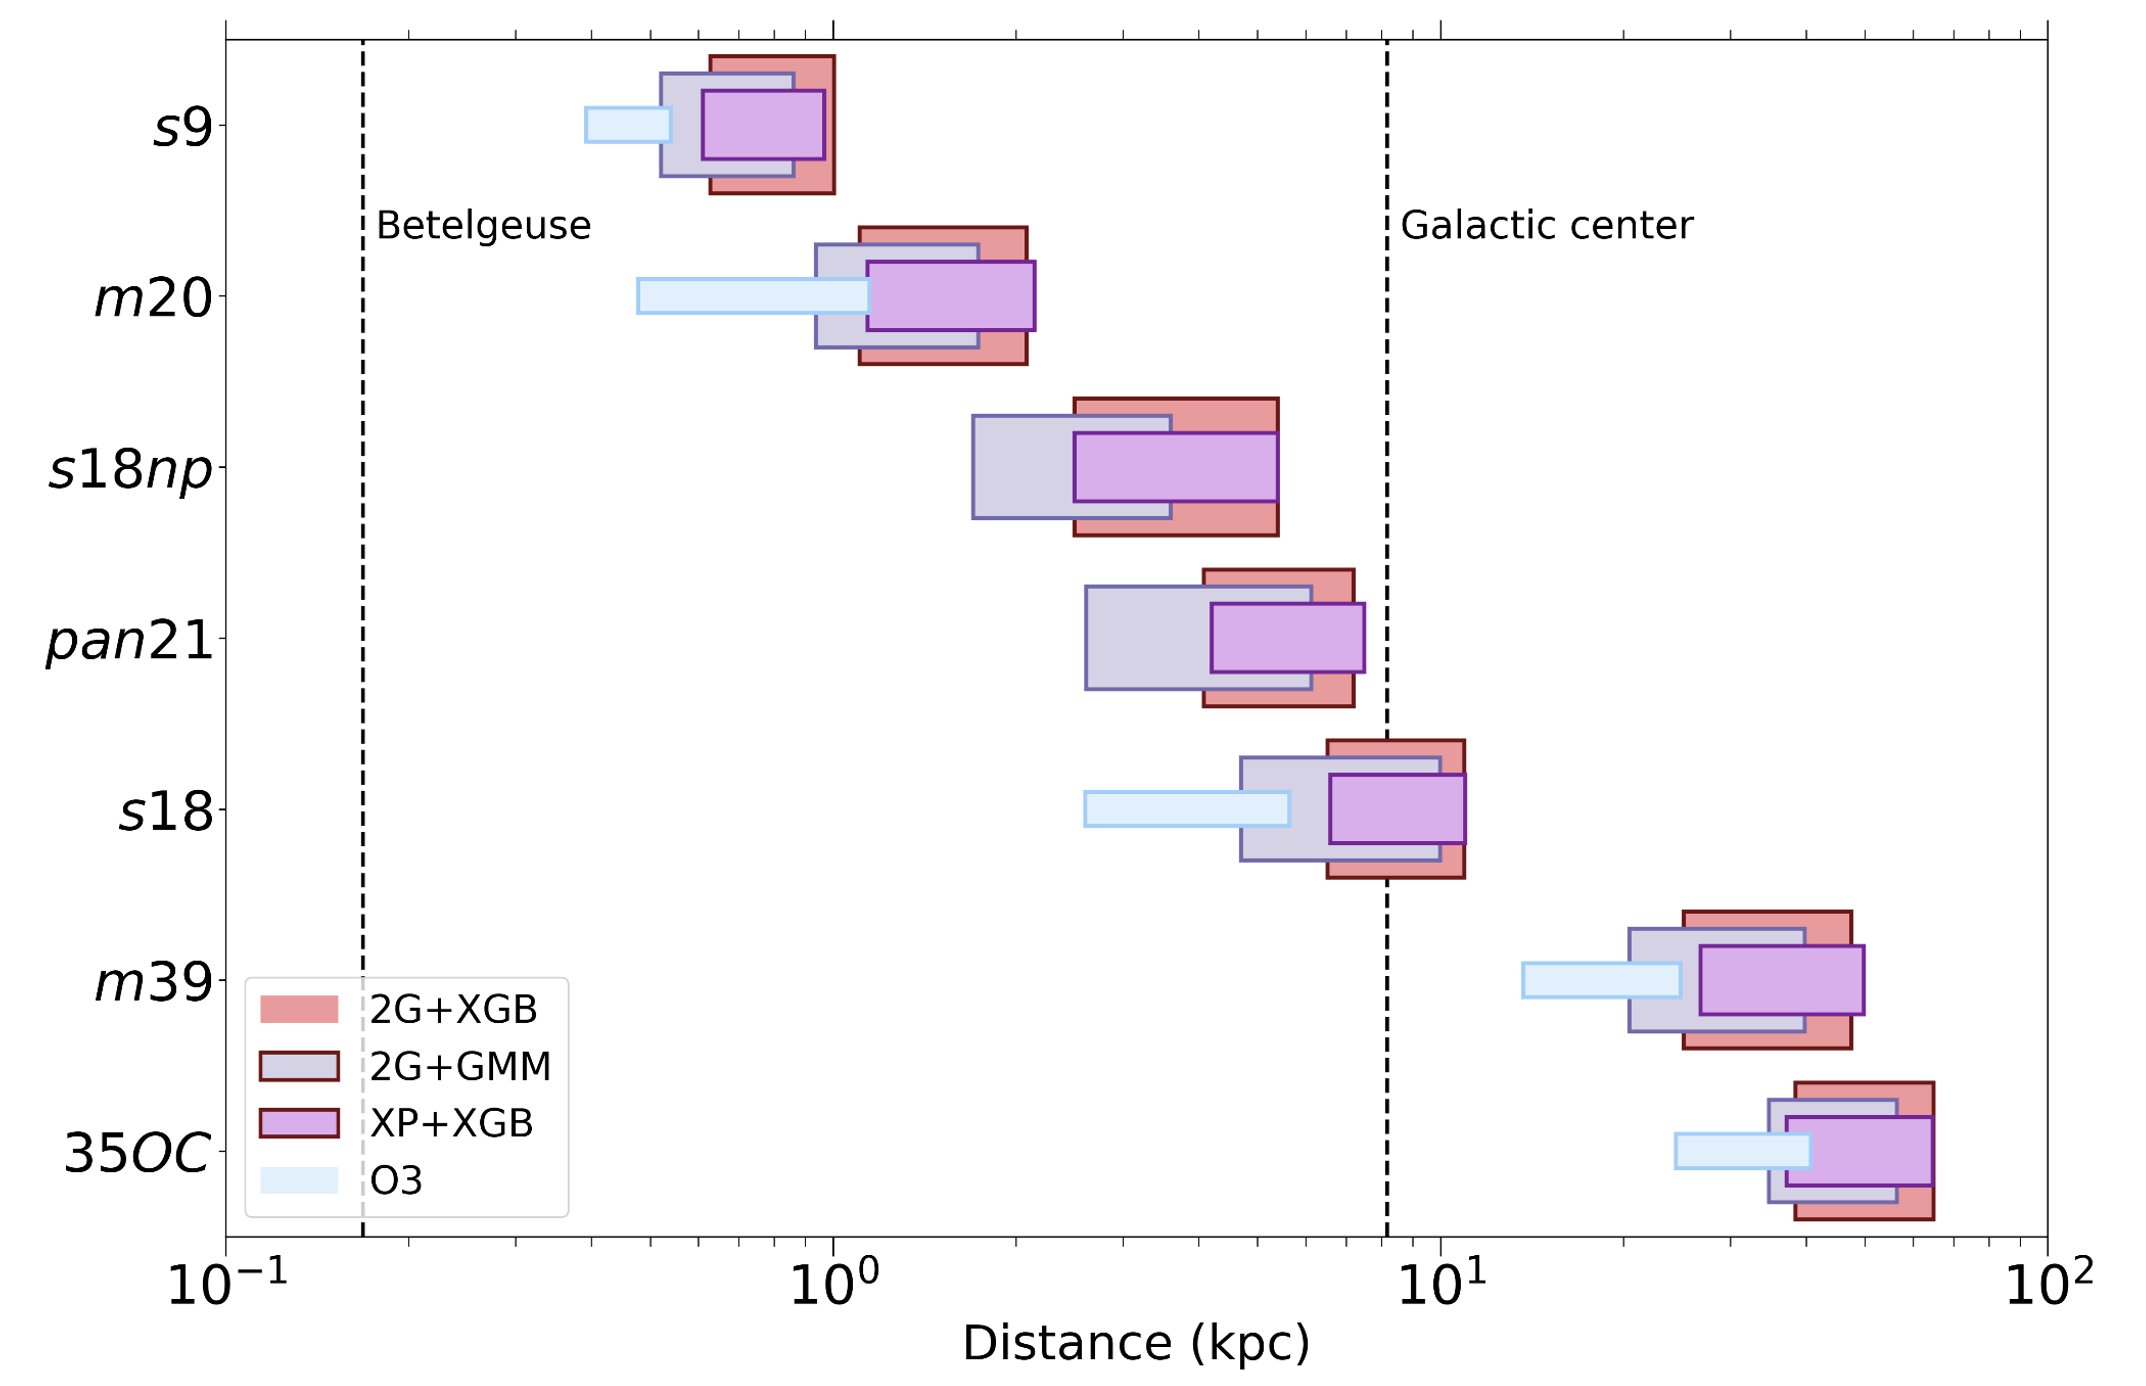
Figure 2: (Figure 5 from the paper): Distances of a source from Earth at which our searches can detect different supernovae waveforms. Betelgeuse, a nearby star that could produce a supernova soon, and the Galactic center, a region with a high rate of supernovae, are marked with dashed lines for reference. The left edge of each box refers to the distance (in thousands of parsecs, denoted kpc) at which we detect 10% of the simulated signals which were added to the data, while the right edge shows the distance corresponding to 50% of signals detected. The vertical axis refers to different supernovae waveforms; see the paper for more details on the models considered. The light blue box shows the sensitivity from the previous observing run O3, showing a marked improvement in the distance at which our searches could see GWs from supernovae, should one occur. The other boxes refer to the different search variants of cWB applied to O4a.
Figures 2 and 3 both illustrate the improvements in sensitivity compared with the same analysis done during O3. The searches are able to detect supernovae signals, as well as a variety of GW bursts (see, e.g. Table II in the paper) out to greater distances than ever before. These sensitivity improvements can be attributed to significant detector upgrades, and search algorithm improvements.
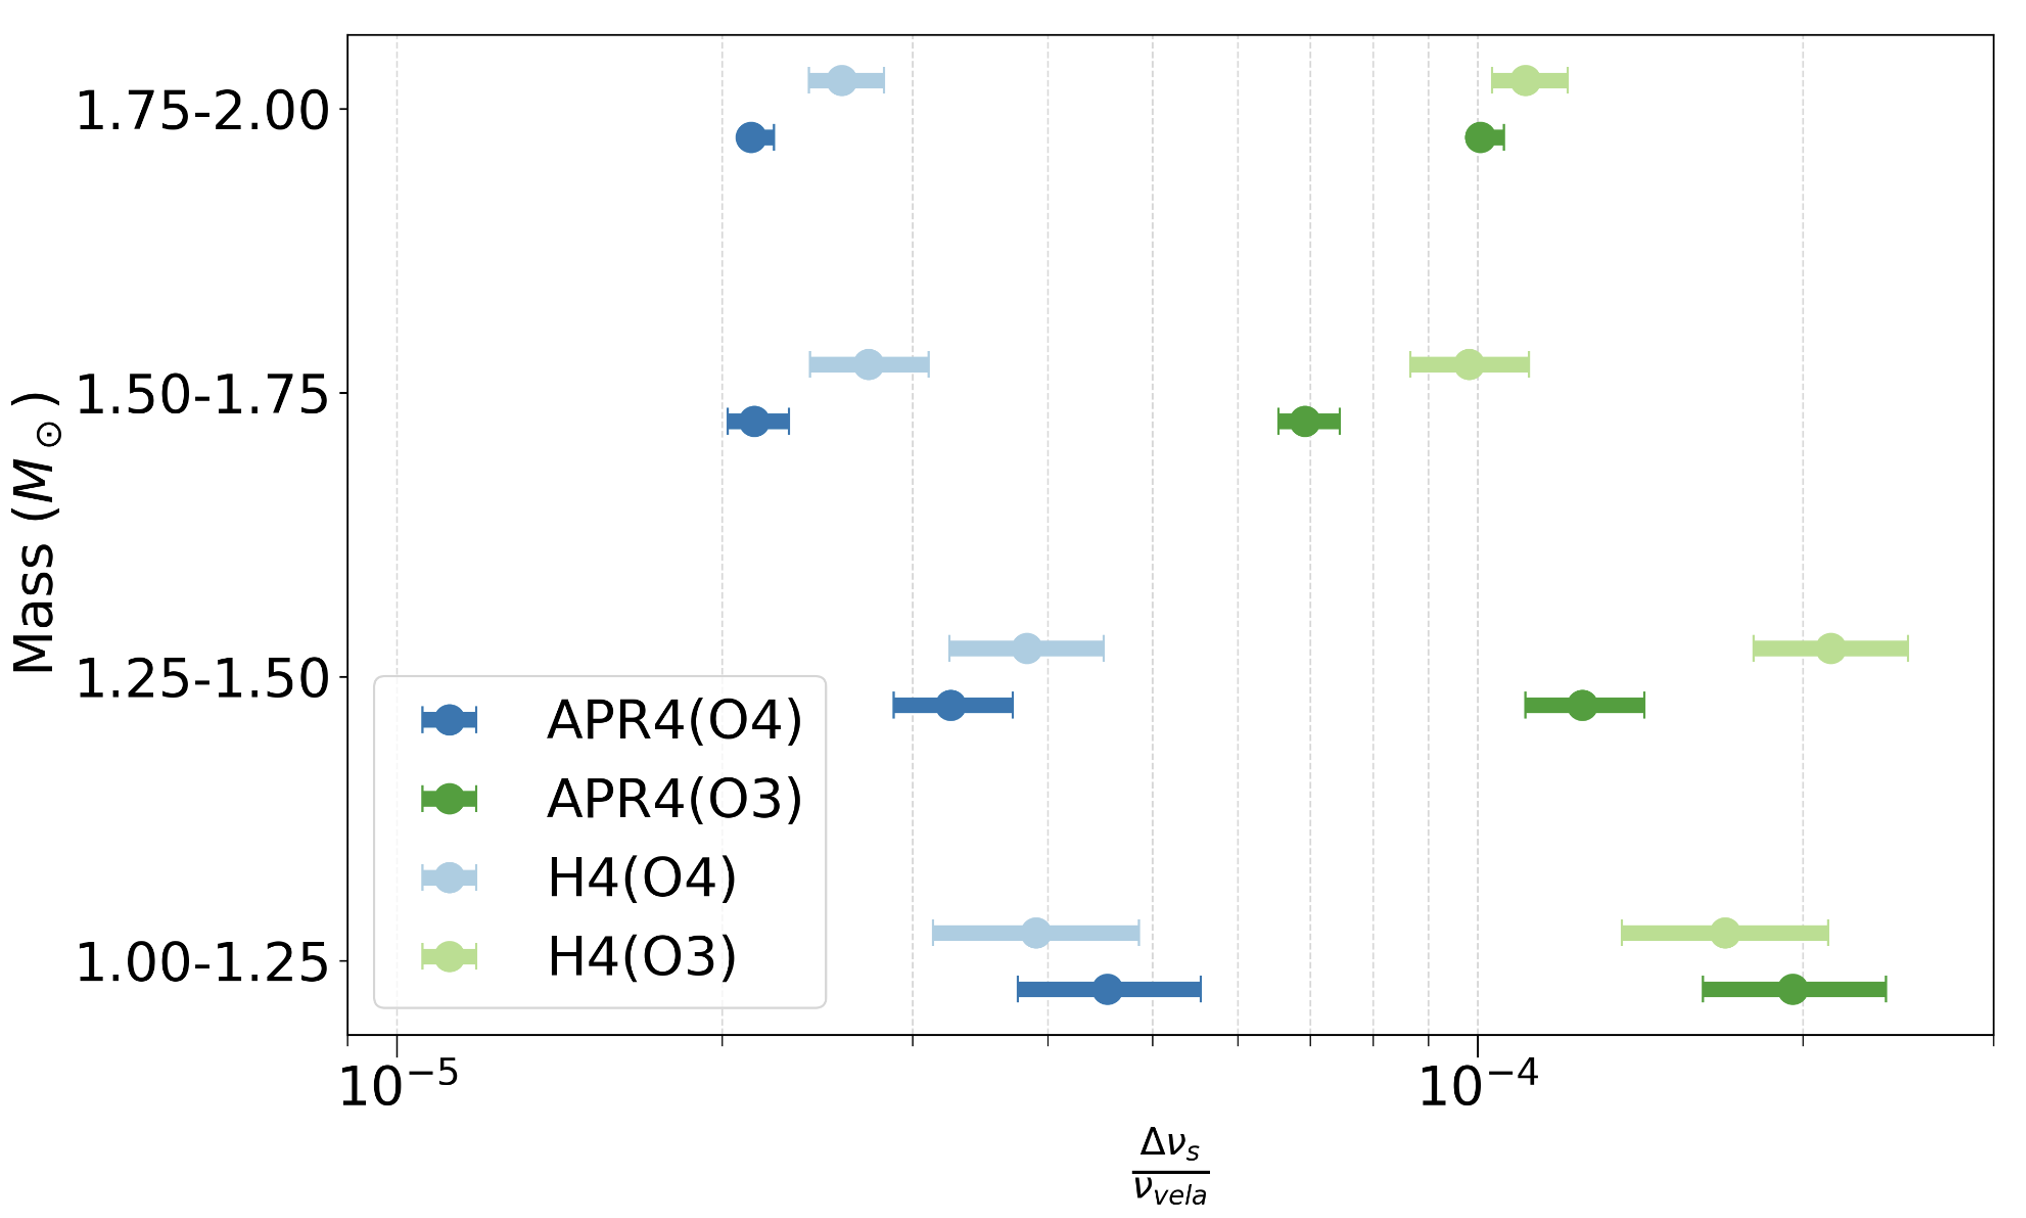
Figure 3: (Figure 6 from the paper): This shows the size of a pulsar glitch (horizontal axis) that could be detected 50% of the time by our analysis. The size is calculated with reference to a Vela-like pulsar — i.e. considering a fixed distance of 900 light years and a spin (rotation around the neutron star’s own axis) frequency of around 11 times per second. The horizontal spread of the boxes represents the variation in the size of pulsar glitch when the different potential mass ranges for the neutron star, as shown on the corresponding vertical axis, are taken into account. Two extreme equations of state are considered, labeled as APR4 and H4. Plotted in green is the sensitivity from O4 and plotted in blue is the sensitivity from the same analysis done in O3. So, in O4 we can detect a smaller size pulsar glitch than in O3. This means the O4 analysis is more sensitive.
Conclusion
So far, the LVK has detected many GWs from CBCs. Why, then, do GWs from burst sources remain so elusive? For one, the GW luminosity (i.e. the strength of the GWs) from CBC’s is much higher than from pulsar glitches or supernovae. The absence of detected short-duration gravitational wave bursts reveals these sources are remarkably rare, occur at distances beyond our detectors current reach, or both. Still, there’s no telling what potential GW sources the universe is harboring, and so we continue to search the deep dark sky.
Find out more:
Back to the overview of science summaries.