
In a new LIGO-Virgo-KAGRA (LVK) publication, we update what we know about how fast the Universe is expanding and test whether gravity behaves as predicted by Einstein’s theory of general relativity. With the most recent LVK data release, GWTC-5.0 (Gravitational Wave Transient Catalog, version 5.0), we now have 236 gravitational wave (GW) detections that can be used to explore what happens in the Universe on its largest scales. This totals 94 more detections than were used in our previous cosmology publication, using GWTC-4.0, which was released in August 2025. One of our main goals using this data is to measure the Hubble constant, H_0 which indicates how fast the Universe is currently expanding. The precise value of this expansion rate is still uncertain, as different methods to measure it give (often very) different results. Our updated measurement of H_0 = 71.0 +9.0 -7.1 km s-1 Mpc-1 is now 25.7% more precise than for GWTC-4.0. However, these measurements are still less precise than those obtained with long-established methods that use only observations of electromagnetic radiation. Our other main goal is to test whether gravitational waves really behave according to general relativity. So far, we don’t find any evidence for deviations from general relativity. However, in the future, we expect GW detections to enable tests of cosmology and gravity that are increasingly competitive with other methods, providing important new ways to improve our understanding of the Universe.
Scientific background
Thanks to incredible advances in technology over the last century, cosmology has developed into a mature scientific discipline. It studies the Universe on its largest scales and aims to answer fundamental questions such as: How did the Universe begin? How has it changed over time? How do matter, energy, and gravity shape its evolution?
Today, the standard theoretical framework used to describe the Universe is known as “Lambda Cold Dark Matter” (LCDM). Grounded in Einstein’s general relativity, this model has successfully explained a wide range of astronomical observations in a single, coherent picture. However, many open questions remain, suggesting that LCDM may not provide a complete description of the Universe, leaving open the possibility of exciting new discoveries.
One of the biggest unexplained puzzles in cosmology is the value of the Hubble constant H_0, the expansion rate of the Universe. Since the 1920s, we have known that the Universe is expanding – all objects in the universe are subtly being carried further apart from each other, like points on the surface of an expanding balloon (See Figure 1). Over the last century, many scientists have tried to measure exactly how fast the Universe has been expanding, with conflicting results even to this day. Measurements from our nearby cosmic neighborhood give us one value for the expansion rate, but separate measurements based on signals from near the beginning of the Universe confidently point to another value. After much debate, the difference between these two measurements likely cannot be explained by measurement errors alone. This discrepancy, known as the Hubble tension, is a clue that LCDM might not be a complete model and that unknown physics could be responsible for the disagreement. This is where GWs come in. Using GWs, we can make another completely independent measurement of the Hubble constant and other cosmological parameters, adding another voice in the Hubble tension conversation and, in the future, perhaps helping to resolve it.
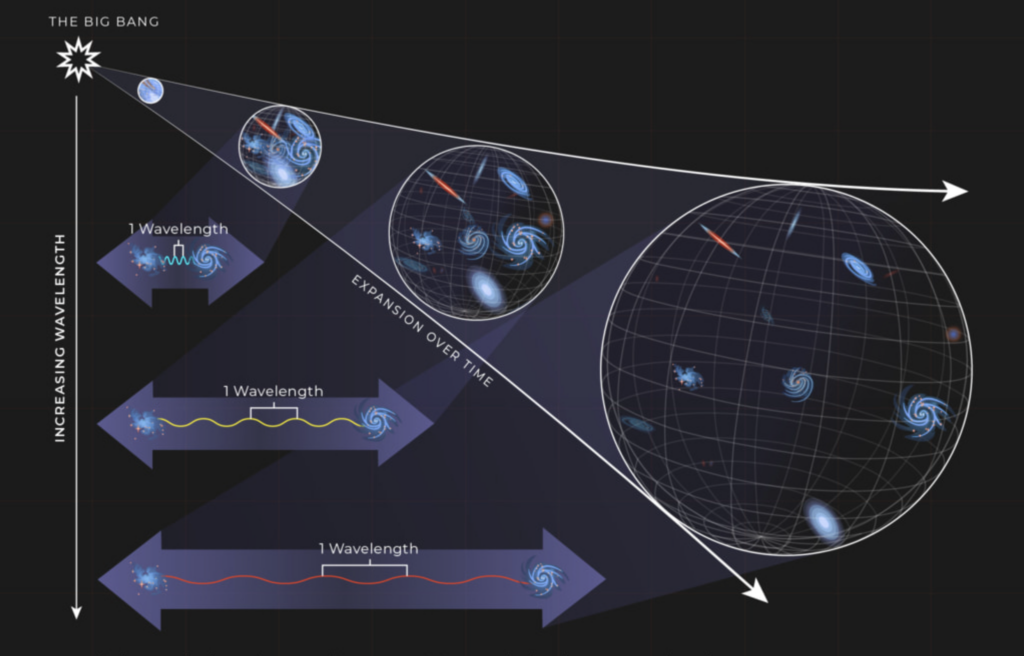
Figure 1. Illustration of how the expansion of the Universe stretches light and gravitational waves over time. Moving from left to right, the Universe grows larger, and galaxies become more widely separated. At the same time, waves traveling through space (shown at the bottom) are stretched to longer wavelengths, as indicated by the “increasing wavelength” axis on the left. This effect, known as redshift, applies to both light and GWs emitted by distant sources. [Credit: NASA Scientific Visualization Studio]
GWs provide a direct way to measure distances in the Universe, without relying on the complex “cosmic distance ladder” used for measurement of distances within our cosmic neighborhood. As these waves travel through space, they become weaker with distance. By analyzing the signal and comparing it with predictions from general relativity, we can estimate how strong it was when it was emitted, and compare this to what we observe on Earth to determine how far away the source is.
For this reason, GW sources are often referred to as “standard sirens” – a nod to the “standard candles” (objects with known intrinsic brightness, such as type Ia supernovae) that astronomers have long used to measure cosmic distances.
Because the expansion of the Universe causes distant galaxies to recede from us, we can combine the distance to a GW source with information about how fast its host galaxy is receding. This allows us to estimate the expansion rate of the Universe.
Not only that, GWs can allow us to test whether general relativity works as we expect, even over the largest possible distances. For example, some alternative theories of gravity predict small changes in how GWs travel through space. These changes could affect how strong the signals appear to us, and therefore how we infer distances. We also test several of these types of theories in our study.
Method
While a GW signal does allow us to calculate the distance to its source, it is not as easy to find out how fast the source is moving away from us (what we call its “recessional velocity”). The best way to determine an object’s recessional velocity is by measuring its redshift, a consequence of the doppler shifted light or other radiation due to the cosmic expansion. This would require us to identify the exact location of the galaxy that hosts the GW source and observe it using a telescope with a specialized instrument called a spectrograph.
We have only once successfully identified the exact source of a GW signal, in the case of the event GW170817, observed on August 17, 2017. This event was caused by the collision of two neutron stars, resulting in both a GW signal and an explosion (called a kilonova) that was visible from Earth. Once the host galaxy (NGC 4993) was identified and its redshift was measured, this event was used to make the first Hubble constant measurement with GWs. We call this method the “bright siren” method.
However, in most cases, we do not know which galaxy hosts a GW source, but the signal tells us roughly where it has originated in the sky. We can then consider all the galaxies in that region using large catalogs, assigning each a probability of being the source. By combining their redshifts, weighted by these probabilities, we can make a statistical measurement of the Hubble constant. This is known as the “galaxy catalog” dark siren method.
Alongside the galaxy catalogs, it is also important to model how the masses of GW sources are distributed. Crucially, the observed distribution of source properties differs from the true, underlying population. This happens partly because of the nature of our detectors, which are more likely to pick up certain sources (like more massive or close by ones) than others (lighter or farther away). Moreover, if the expansion history of the universe or the laws of gravity were different – for example, if dark energy had unexpected properties – this would change the relationship of source properties between the true and observed populations. Comparing the expected source population properties to the observed ones, and carefully accounting for the different detection probability, or “selection bias”, can allow us to measure cosmological properties like the Hubble constant even without using galaxy catalogs. This is known as the “spectral siren” method.
When we combine the spectral and galaxy catalog methods, we can utilize information about the distributions of both galaxies and GWs to arrive at a better, unified dark siren measurement. While an individual dark siren would give a much less precise measurement than with the bright siren method, we have many more dark sirens than bright sirens, which means that our combined dark siren result achieves similar precision. Our final Hubble constant result combines all of these methods into a full standard siren measurement from all the available GW information.
Results
Figure 2 shows posterior probability distributions for the value of H_0 using different combinations of the GWTC-5.0 dataset. The black curve shows the most precise result, combining dark sirens with the bright siren GW170817. From the position and width of the peak of the curve, we obtain H_0 = 71.0 +9.0 -7.1 km s-1 Mpc-1. Here the subscript and superscript numbers give our error on this measurement at the 68% credible level.
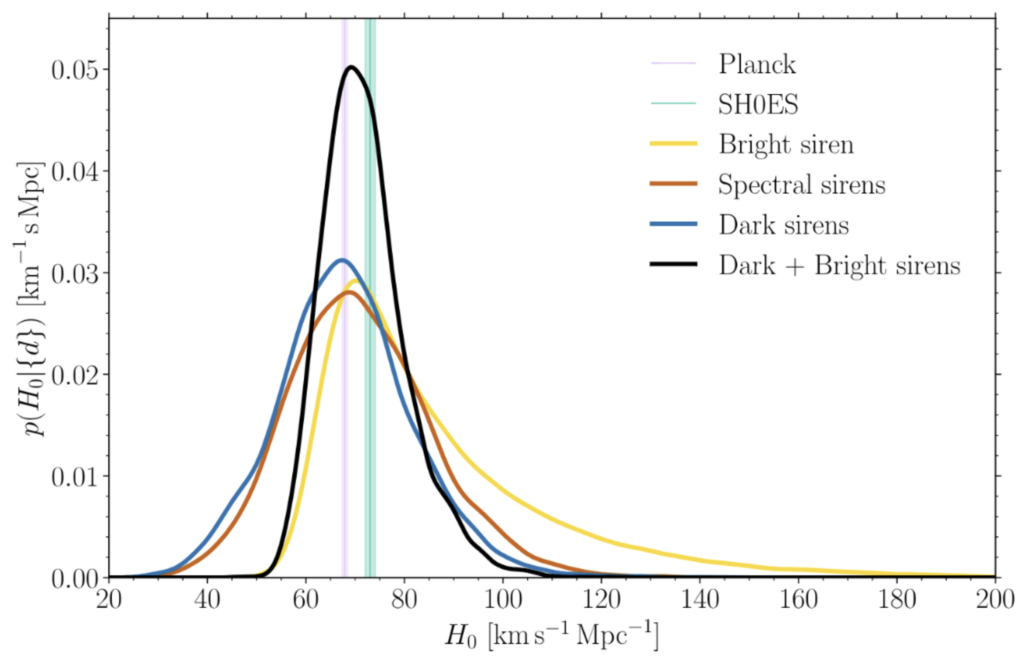
Figure 2. (Figure 4 from our publication) Our Hubble constant (H_0) measurement. The best estimate comes from the combination of the dark siren analysis with the bright siren result of GW170817 (black). For comparison, results with only dark sirens (blue), spectral sirens (orange), and the single bright siren (yellow) are also shown.
Our results represent a 25.7% improvement in precision over our analysis from the previous LVK data release, mainly driven by the inclusion of a larger number of events. The extra events allow the mass distribution of GW sources to be much better constrained. The improvement from the inclusion of galaxy catalogs is an extra 7.4% over spectral sirens, in line with the comparable galaxy catalog improvement in GWTC-4.0.
Figure 3 presents our constraints on possible deviations from general relativity in how GWs propagate through an expanding universe. Specifically, we examine the ratio between the distance measured from the GW (labelled D^GW_L) and the distance that would be measured from an associated detection with light (labelled D^EM_L). If general relativity is correct, these two distance measures should match exactly, so their ratio should equal one at all redshifts. We test this ratio using two different models, representing two different ways that gravity and dark energy could interact, and place limits on their corresponding model parameters. The top and bottom panels of Figure 3 show the results for each model, which are in good agreement with each other.
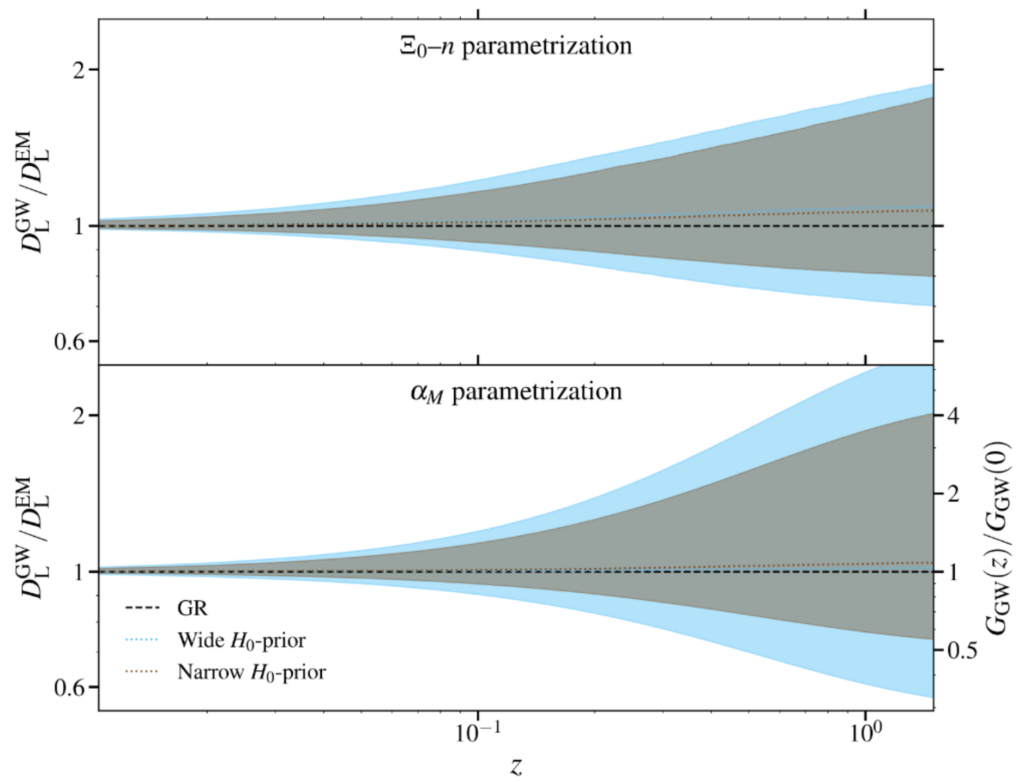
Figure 3. (Figure 7 from our publication) Ratio of the distance measured from GW sources to the distance that would be measured from an electromagnetic emission from the same source, as a function of the source redshift, for two different models representing two different ways that gravity and dark energy could interact. The upper and lower panels refer to two different parametric forms adopted to describe this effect, where if the theory of general relativity holds, the two distances are expected to be the same, so that their ratio would be identically equal to one at all redshifts (black dashed line). The colored bands show the constraints obtained from GWTC-5.0 at the 90% credible level. The blue bands represent the case where we do not assume any previous (or ‘prior’) information about the Hubble constant, while the brown bands represent the case where we assume that H_0 is close to its previously measured values. Our results are consistent for both upper and lower panels and we find no evidence for deviations from general relativity.
We find no evidence for deviations from general relativity in either model, with our best measurement improving previous constraints by about 20-50%, depending on the model. The bright siren GW170817 does not contribute significantly here, because the effect of a deviation from general relativity builds up as the GW and light signals propagate; only sources at significant redshift would provide information about any such deviation. By contrast, GW170817 was simply too close to allow this effect to be tested.
Summary and future prospects
Using the GWTC-5.0 dataset, we obtain a new, independent measurement of the Hubble constant, along with improved constraints on possible deviations from general relativity. Our best estimate of the Hubble constant is 71.0 +9.0 -7.1 km s-1 Mpc-1, which is 25.7% more precise than with GWTC-4.0. This value is entirely consistent with long-established measurements from both our cosmic neighborhood and the early Universe, but is not yet precise enough to resolve the tension between those measurements.
The spectral siren method (using the distribution of GW source masses) is currently the main source of precision for dark sirens. The additional information from galaxy catalogs improves the measurement by 7.4%, similar to GWTC-4.0. The constraint on spectral sirens scales inversely with the square root of the number of events, which means that each additional event provides diminishing improvement. This motivates the preparation of better galaxy catalogs and GW data for the upcoming GWTC-6.0 release.
Our study finds no deviation from general relativity at the largest scales, with constraints now about 20-50% tighter than previous limits, depending on the model.
These results show that, with more data on the way and robust statistical methods now in place, GW cosmology is well-positioned to tackle some of the biggest open questions in modern physics.
Glossary
- Megaparsec (Mpc): unit of distance commonly used in cosmology. One megaparsec is equal to one million parsecs, where a parsec is equal to about three and a quarter light years or 3.086 x 10^16 meters.
- Hubble constant: A measure of how fast the Universe is expanding. Its present-day value is denoted by the symbol H_0 (where the ‘0’ indicated the present time). It is measured to be about 70 km s-1 Mpc-1, meaning that for every megaparsec (about 3 million light-years) of distance, a galaxy appears to move away from us about 70 km/s faster.
- Redshift: Increase in wavelength (of sound, light, or gravitational waves) due to motion of the source with respect to the observer. Due to the cosmological expansion of the universe, objects such as galaxies are receding from us, and light and other radiation coming from them has a longer wavelength.
- Posterior probability distribution: graph or plot showing how likely are different values of a given physical quantity, after analysing our data and also taking account any prior information available about the quantity, estimated through a process known as Bayesian Inference.
Find out more:
- Visit our websites:
- Read a free preprint of the full scientific article:
https://dcc.ligo.org/LIGO-P2600018/public/
or on arXiv: https://arxiv.org/abs/2605.27227 - Gravitational-Wave Open Science Centre data release for GWTC-5.0:
https://gwosc.org/GWTC-5.0/
Back to the overview of science summaries.