On June 15, 2016, the LIGO Scientific Collaboration and Virgo Collaboration announced the second confirmed observation of gravitational waves from colliding black holes. The gravitational wave signals were observed by the LIGO’s twin observatories on December 26, 2015.
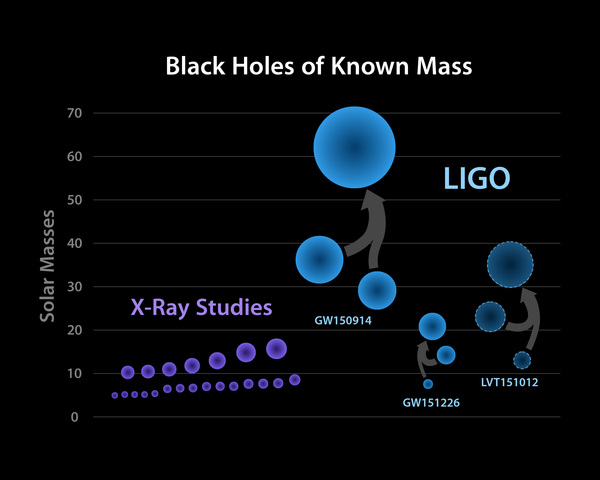
Black holes of known masses. LIGO has definitively detected two sets of black hole mergers (bright blue). For each event, LIGO determined the individual masses of the black holes before they merged, as well as the mass of the black hole produced by the merger. The black holes shown with a dotted border represent a LIGO candidate event that was too weak to be conclusively claimed as a detection. Black hole masses determined via x-ray measurements are shown in purple. (Image Credit: LIGO.) [Download additional file sizes here.]
Publications & Documentation
- Publication: GW151226: Observation of Gravitational Waves from a 22 Solar-mass Binary Black Hole Coalescence – published in Physical Review Letters 116, 241103 (2016).
- Companion paper: Binary Black Hole Mergers in the First Advanced LIGO Observing Run – published in Physical Review X 6, 041015 (2016). See here for a full list of companion papers.
- Press Release [PDF]. Also in Bengali | German | Hindi | Italian | Korean | Malayalam | Marathi | Oriya | Portuguese | Romanian | Siksika (Blackfoot) | Spanish | Thai.
- Science summary. Also in French | German | Spanish.
- Data release (LIGO Open Science Center/LOSC). See also the LOSC Python tutorial on GW151226.
- GW151226 Factsheet and Infographic.
- Additional resources at the LIGO Lab GW151226 detection website.
- Additional resources at the Caltech announcement website.
- Additional information and video at the MIT News website.
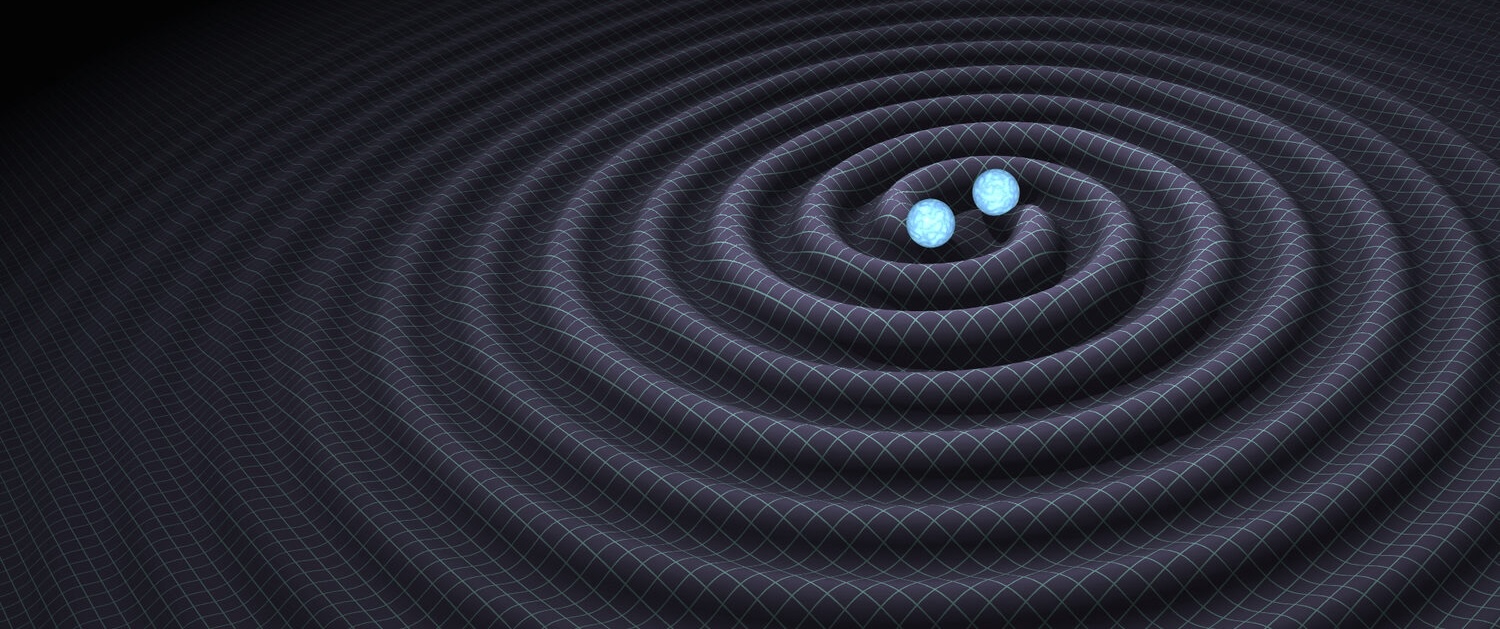
Artist’s depiction of the merger of two black holes and the gravitational waves that ripple outward as the black holes spiral toward each other. The black holes—which represent those detected by LIGO on Dec. 26, 2015—were 14 and 8 times the mass of the sun, until they merged, forming a single black hole 21 times the mass of the sun. In reality, the area near the black holes would appear highly warped, and the gravitational waves would be difficult to see directly. (Image credit: LIGO/T. Pyle.) [Download additional file sizes here.]
Comparing “chirps” from observed binary black hole mergers.. The best-fit models of LIGO’s gravitational-wave signals are converted into sounds. The first sound is from modeled gravitational waves detected by LIGO on Dec. 26, 2015, when two black holes merged. This is then compared to the first-ever gravitational waves detected by LIGO on Sept. 14, 2015, when two higher-mass black holes merged. This sequence is repeated. The pitch of both signals is then increased, allowing them to be heard more easily, and this sequence is also repeated. (Credit: LIGO.)
Images & Videos
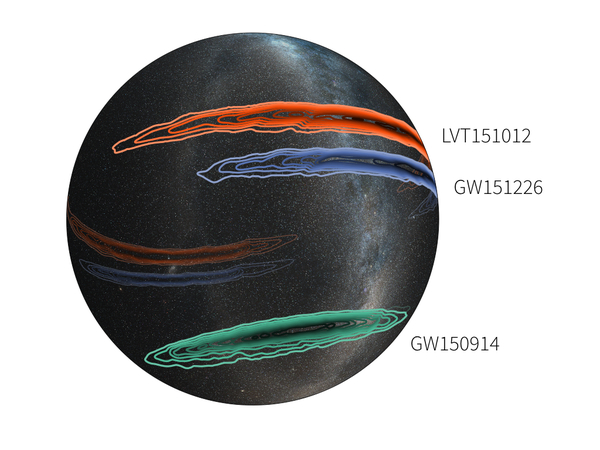
Sky locations of LIGO events during the first observing run. This three-dimensional projection of the Milky Way onto a transparent globe shows the probable locations of all three LIGO events detected during the first observing run. Different colors are used to represent each event. Two are confirmed detections: GW150914 (green), and GW151226 (blue) while the third is a possible detection at lower significance (LVT151012, red). The outer contour for each represents the 90 percent confidence region while the innermost contour is the 10 percent region. (Image credit: LIGO/Leo Singer. Milky Way image: Axel Mellinger.) [Download additional file sizes here.]
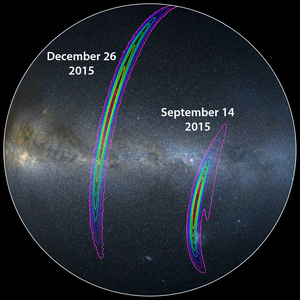
Sky locations of confirmed LIGO detections. The approximate locations of the two gravitational-wave events detected so far by LIGO are shown on this sky map of the southern hemisphere. The colored lines represent different probabilities for where the signal originated: the outer purple line defines the region where the signal is predicted to have come from with a 90 percent confidence level; the inner yellow line defines the target region at a 10 percent confidence level. (Image credit: LIGO/Axel Mellinger.) [Download additional file sizes here.]
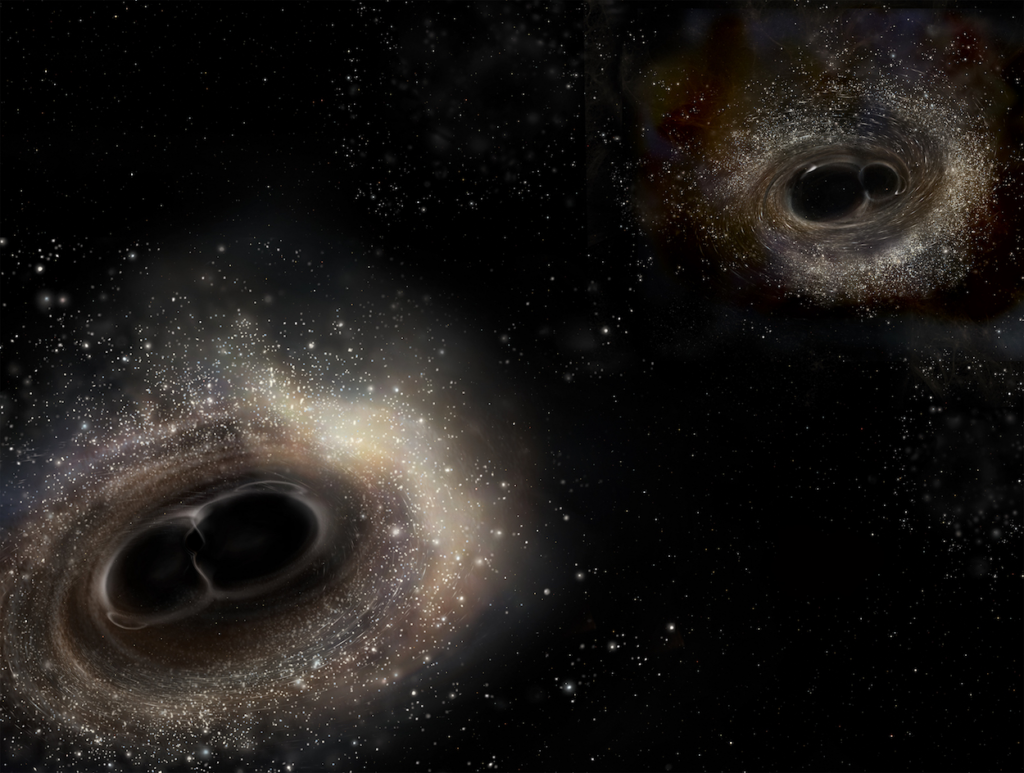
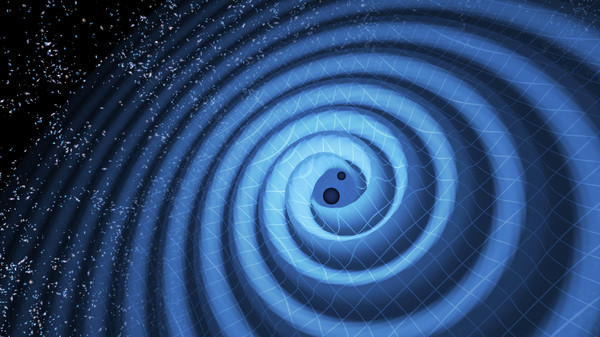
Artist’s illustration comparing the merging black hole binary systems for GW150914 (left) and GW151226 (right). The black hole pairs are shown together in this illustration, but were actually detected at different times, and on different parts of the sky. The images have been scaled to show the difference in black hole masses. In the GW150914 event, the black holes were 29 and 36 times that of our Sun, while in GW151226, the two black holes weighed in at 14 and 8 solar masses. (Image credit: LIGO/A. Simonnet.)
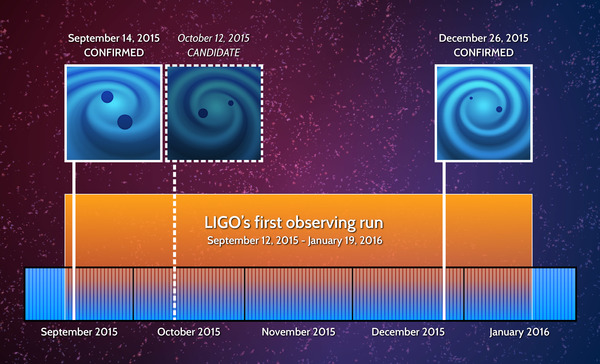
Timeline of LIGO’s First Observing Run. This illustration shows the dates for two confirmed gravitational-wave detections by LIGO, as well as one candidate detection (which was too weak to unambiguously confirm). All three events occurred during the first four-month run of Advanced LIGO—the upgraded, more-sensitive version of the facilities. The three events are GW150914 (Sept. 14, 2015), LVT151012 (Oct. 12, 2015), and GW151226 (Dec. 26, 2015). (Image credit: LIGO.) [Download additional file sizes here.]
Simulation of the inspiral and collision of two black holes consistent with GW151226. The top portion of the frame shows the horizons of the two holes. The lower portion of the frame shows the gravitational waveform projected onto the LIGO Livingston detector, as well as the frequency of the gravitational wave. This system spends about 55 gravitational wave cycles in the LIGO band, during which the frequency increases from about 35Hz to above 700Hz. (Credit: A. Babul/H. Pfeiffer/SXS Collaboration.)
Numerical simulation of the gravitational waves and binary black hole coalescence consistent with GW151226. The two black holes have a mass ratio of nearly 3, which lies in the possible predicted mass range for the binary system. Starting at a frequency of 35Hz, we show the last 55 gravitational-wave cycles before merger. Most of the signal-to-noise ratio for the event GW151226 is accumulated during those cycles.
The strength of the gravitational wave is indicated by elevation as well as color, with cyan indicating weak fields and orange indicating strong fields. The amplitude of the gravitational wave is rescaled during the simulation to show the signal during the entire animation (not only close to merger, where it is strongest). The sizes of the black holes as well as the distance between the two objects is increased by a factor of two to improve visibility. The colors on the black holes represent their local deformation due to their intrinsic rotation (spin) and tides.
The movie shows the process in slow motion. The animation would last approximately 1 second from beginning to end in real time. Due to the length of 55 gravitational-wave cycles, the simulation is shown with different speeds, i.e., the last 10 cycles are shown 2.5 times slower than the first part. This improves visibility of the merger and ringdown of the remnant black hole. [Numerical simulation credit: S. Ossokine, A. Buonanno (Max Planck Institute for Gravitational Physics) and the SXS Collaboration. Scientific Visualization: T. Dietrich, R. Haas (Max Planck Institute for Gravitational Physics).]
Artist’s animation showing the merger of two black holes and the gravitational waves that ripple outward during the event. The black holes—which represent those detected by LIGO on Dec. 26, 2015—were 14 and 8 times the mass of the sun, until they merged, forming a single black hole 21 times the sun’s mass. One solar mass was converted to gravitational waves. In reality, the area near the black holes would appear highly warped, and the gravitational waves would be difficult to see directly. (Credit: LIGO/T. Pyle.)