
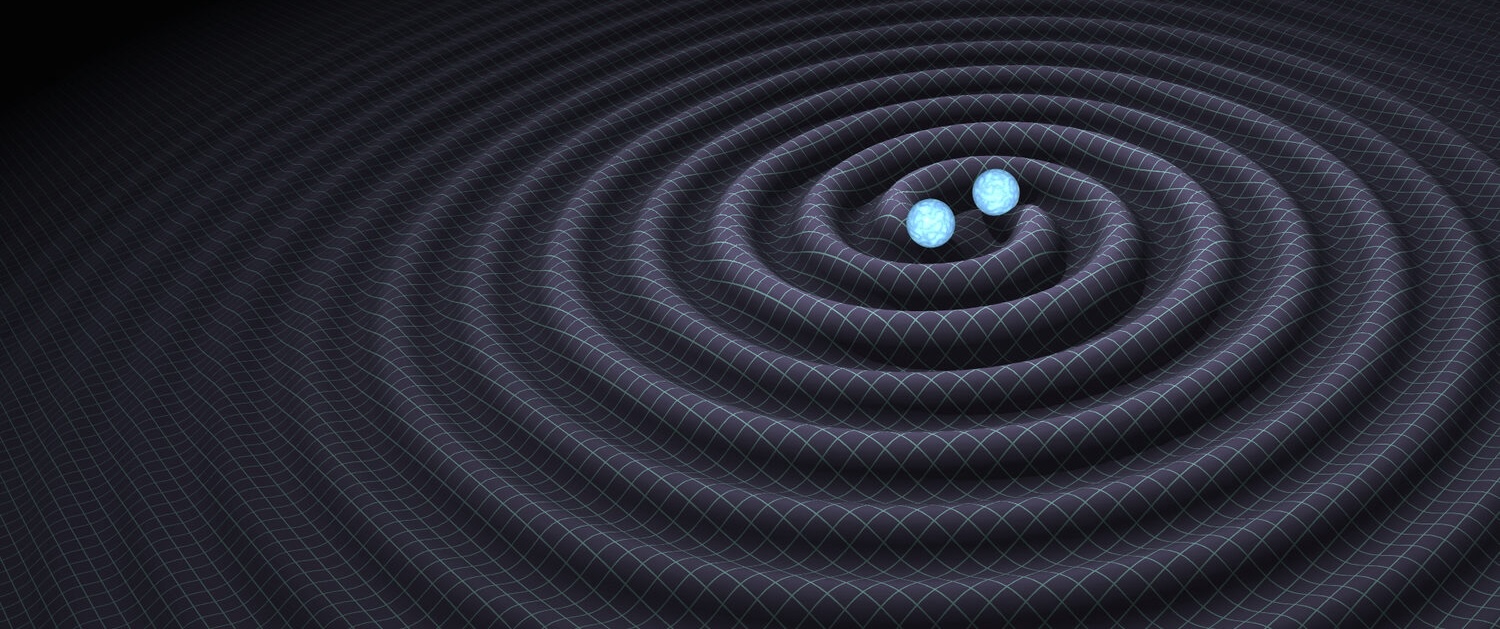
In May 2026, the LIGO-Virgo-KAGRA (LVK) Collaborations released the interferometric strain data from the second part of the fourth observing run (O4b) which ran from April 2024 through January 2025 – a roughly nine-month period of searching for gravitational waves (GWs) from merging compact objects such as neutron stars and black holes. In these data, we have discovered 161 new confident GW signals, all of which are consistent with originating from merging black holes. (Unlike the previous catalog release, no new neutron star-containing events were identified during O4b.) Alongside the strain data release, we publish version 5.0 of the Gravitational Wave Transient Catalog (GWTC-5.0), which contains lists of the candidate GW signals and measurements of their properties. GWTC-5.0 also includes refined analysis of some previously-released candidates. A set of papers accompany the catalog. Here, we summarise the first three of these papers that focus on the production and results from GWTC-5.0 itself.
Introduction
The first paper, entitled “GWTC-5.0: An Introduction to Version 5.0 of the Gravitational-Wave Transient Catalog”, serves as an overview of the catalog. It includes information about the nomenclature, details of the catalog release, and an outline of the companion papers that will accompany it. The paper is intended to help orient new readers to the catalog without requiring them to read through all earlier versions of the manuscripts.
The name game
We name our GW events using the date and time that we detect them, in Coordinated Universal Time (UTC). For example, the event GW200105_162426 was detected on the 5th of January 2020 at 16:24:26 UTC. (Some events, like GW150914 or GW250114, are sufficiently exceptional that we drop the time stamp to improve readability when we write about them.) We add the prefix GW to all of the candidate signals we detect, even if there is a chance they may not be of astrophysical origin. This is consistent with how events were presented in the most recent catalog update (GWTC-4.0) but is notably different from how candidates were treated in earlier catalog releases. With that being said, for inclusion in the catalog, events need to have a high probability (at least 50%) of being astrophysical in origin and need to pass all of our data quality checks.
There can be only one (catalog)
In keeping with past GWTC updates, the contents of GWTC-5.0 are cumulative. This means that each new catalog includes not only new candidates identified in previously unreleased data (O4b this time), but also all candidates from each of the past runs. This is to say that GWTC-5.0 supersedes all previous catalog releases. Moreover, GWTC-5.0 also includes updated search results and estimated source properties for additional events from the first part of O4 (O4a). That subset of the catalog is named GWTC-4.1, in keeping with the naming convention introduced alongside the previous version of the catalog, wherein minor version numbers (the .0 and .1) are incremented anytime there is a modification to previously released results. At any given time, the catalog with the largest number is the reference LVK publication.
This means that GWTC-5.0 contains all confident GW transient candidates from the first Observing run (O1, beginning September 2015) through the second part of the fourth observing run (O4b), and everything in between. Along the way, our detectors have grown progressively more sensitive. You can see the history of sensitivity improvements in the observing run timeline shown in Figure 1.
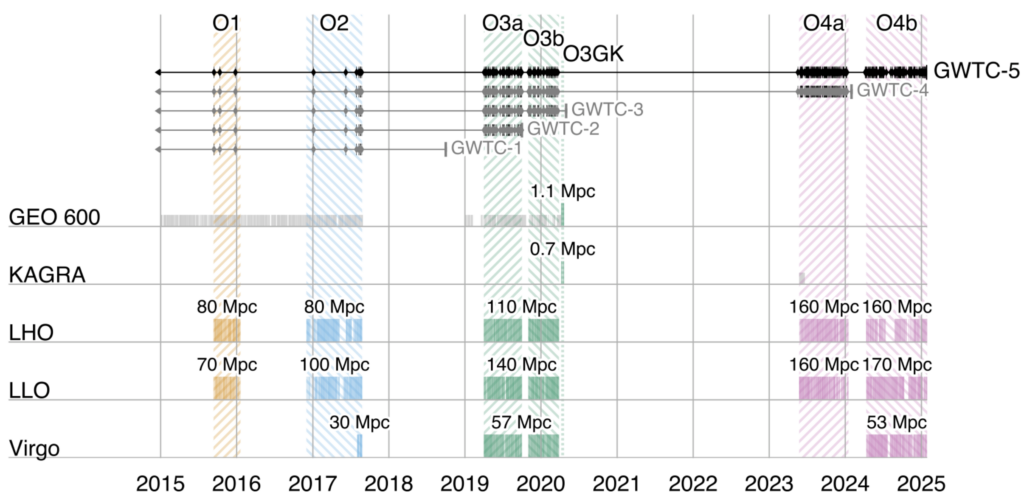
Figure 1: A timeline of observing runs showing the data-taking periods for the GW observatories GEO 600, KAGRA, LIGO-Hanford (LHO), LIGO-Livingston (LLO), and Virgo. Numbers above the coloured blocks correspond to the approximate distance (in megaparsecs, Mpc) the detector can see a standard binary neutron star merger, providing a measure of its sensitivity. Along the top, we provide markers for when events have been detected, as well as horizontal bars showing the span of data in each catalog.
You may also notice in Figure 1 that the Virgo detector joined the O4 run during O4b at sensitivities comparable to what was demonstrated during the third observing run. This is noteworthy not only because it increases the overall sensitivity of the detector network, but also because it vastly improves the network’s ability to pinpoint the location of each event on the sky – we’ll see a striking example of this in the results section.
Exploring the Universe one hypervolume at a time
The improved angular resolution on the sky, coupled with the improved distance sensitivity, means that O4b represents the most sensitive GW search to date. We often quantify this by figuring out the 4-dimensional volume (in both time and space) that the detectors have observed. In keeping with previous catalog releases, we call this a ‘hypervolume’ because it’s a volume in four dimensions. We simulate what the GW signals should look like in our detectors, if they were to occur at various astrophysical distances and locations throughout the sky. We then test to see if our analysis software can successfully find the simulated signals when we artificially insert them into our data. Once we correct for the percentage of time our detectors are online – that is, their duty cycle – we are able to arrive at a realistic estimate of the hypervolume in the nearby universe from which we can reliably detect GW emission.
In Figure 2, we plot an update to this hypervolume against the cumulative number of detections. This shows how many signals were detected in each observing run and visualises that, in O4b, we have again nearly doubled the number of observed signals!
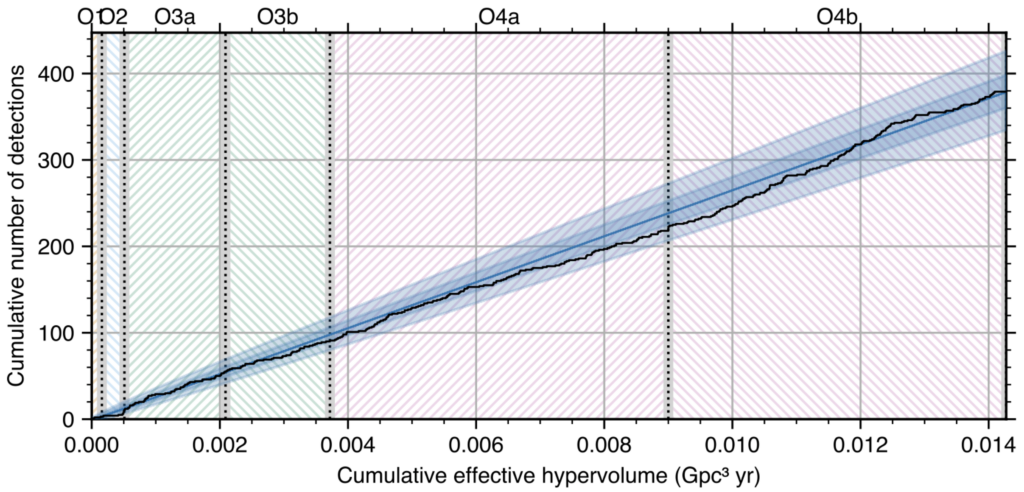
Figure 2: The cumulative number of detections plotted against the approximate space-time hypervolume surveyed by the detectors, showing both the increase in the number of GW events we have detected alongside how much we have explored the local universe. The black line tracks the events we have detected, and the shaded blue bands around it show the uncertainty in that measurement. The uncertainty comes from the fact that even events that have a high probability of being astrophysical in origin have a chance (however small) of being something else. This uncertainty builds up as we observe more and more events, giving us a statistical measure of how well we understand our total count.
As a testament to the increased search sensitivity, when you compare the first two parts of O4 (O4a + O4b) to earlier runs, we find that the O4 results account for roughly 75% of the total number of GW detections to date. (Figure 3 shows another way to visualize this.)
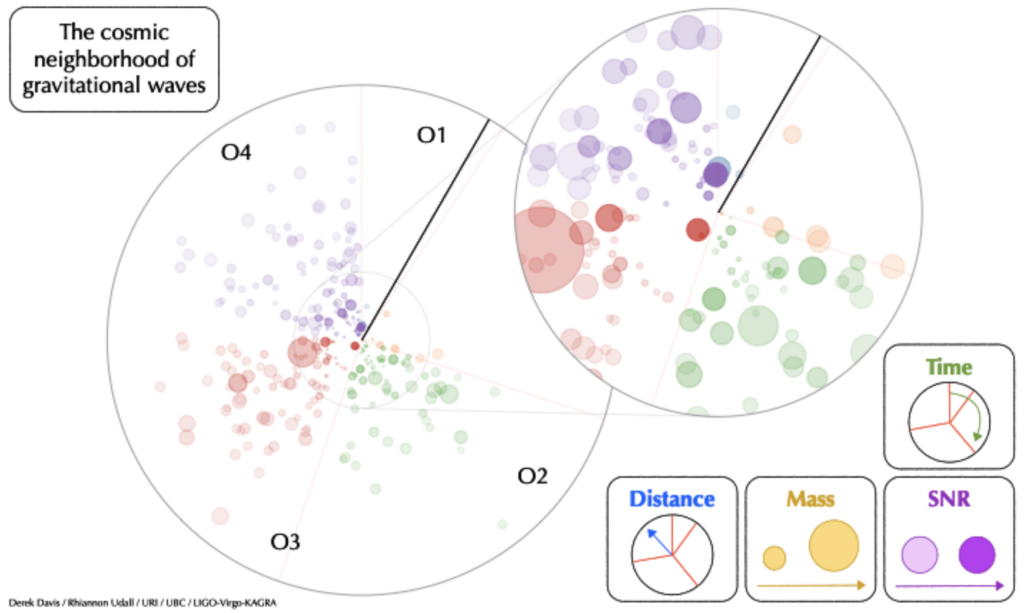
Figure 3. Even though the fourth observing run represents less than half of the total time spent observing, it accounts for roughly 75% of all GW detections to date. In this pie chart, each GW event is represented by a circle. The size of each circle represents the total mass of the merger. How darkly each circle is shaded represents how ‘loud’ the event was in our detector (as measured by Signal-to-Noise ratio, or SNR). Each circle’s distance from the center of the chart represents how far from Earth the merger occurred. Each pie slice represents one of the observing runs (O1 through O4, up to O4b), with the time of each event progressing clockwise around each slice.
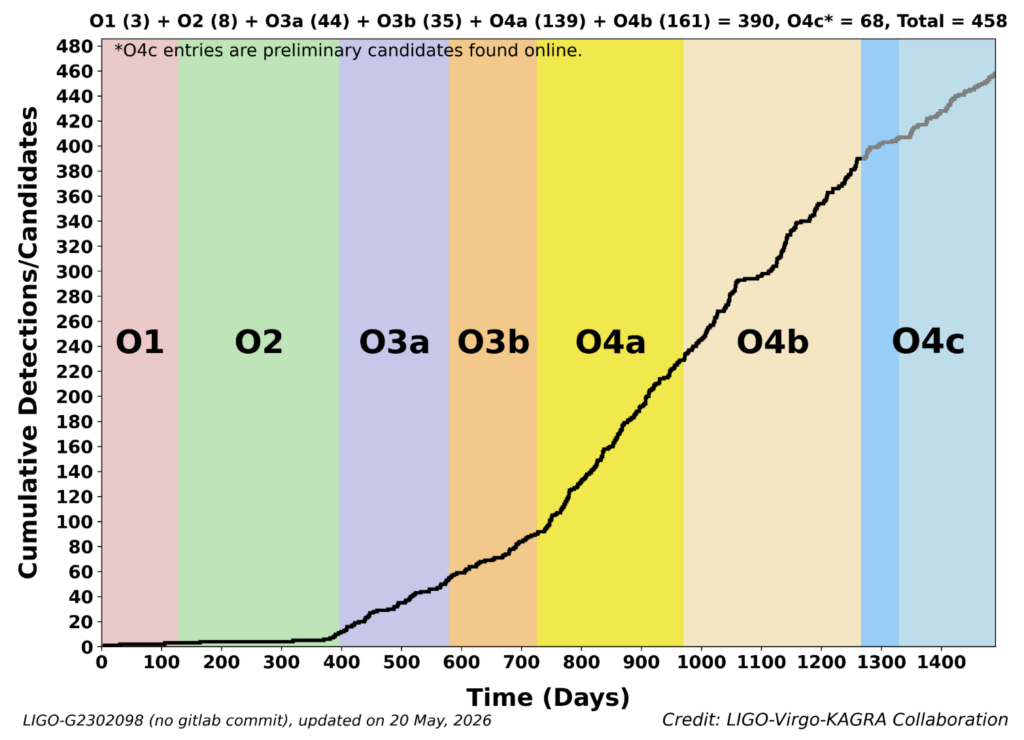
Figure 4. GWTC-4.0 famously (more than) doubled the total number of reported candidates from ~90 (circa GWTC-3.0) to over 200 (circa GWTC-4.0). With 390 total events through the end of O4b in GWTC-5.0, we have nearly doubled the size of the catalog again! The remaining detection candidates from the third, and final, portion of O4 (O4c) will be analyzed and released in a subsequent version of the catalog.
Methods
The second paper, entitled “GWTC-5.0: Methods for Identifying and Characterizing Gravitational-wave Transients”, provides the details of the methodology used to produce GWTC-5.0. The beginning of the paper covers the techniques used to model the GW signals we are searching for, and the analysis software we use to search for them in the data. It then describes how we handle noise fluctuations that can impact the quality of our data. The paper concludes with an overview of the tools we use to estimate the astrophysical parameters of each system (such as the masses of the compact objects that have merged), verify the consistency of our results, and manage the complex data structures needed to complete all of this ambitious work.
Practice makes perfect
A majority of the core methodology in GWTC-5.0 remains largely unchanged from the GWTC-4.0 analysis of O4a events. But we have also identified and fixed several small bugs, including one that affects how we calibrate our data, and another that affects the techniques we use to estimate the astrophysical properties of each event. In all cases, the effects from these bugs fall well within the statistical uncertainties of individual events, and none of the scientific conclusions from previous catalog releases are affected.
Remembering our roots as we continue to grow
In keeping with conventions from previous catalog updates, the methods paper also contains historical descriptions of the algorithms used as far back as the first observing run. This is essential because the GWTC is a cumulative catalog – it includes all prior results, even if we have not reanalyzed them. As a result, if someone wants to understand an event from the first observing run (say, for example, the first detection, GW150914) while browsing the GWTC-5.0 catalog, they would need the full context of the analysis tools that were used at the time. The goal is to ensure that readers who are new to the catalog need not consult earlier versions of the catalog papers to get fully caught up to its current state.
Alongside this historical context, we also strive to incorporate powerful new techniques to continue to enhance and improve our analyses with each subsequent catalog release. For GWTC-5.0, we have added machine-learning-enhanced analyses as a form of cross-validation to improve confidence in our results. These new approaches train neural networks on large libraries of simulated signals so that, once trained, they can estimate the properties of a new signal in a tiny fraction of the time required so far by our traditional analysis methods. A subsequent reweighting step corrects for any small discrepancies between the neural network’s quick approximation and a more rigorous calculation.
Results
The third paper, entitled “GWTC-5.0: Observations from the Second Part of the Fourth LIGO-Virgo-KAGRA Observing Run and Updates to the Gravitational-Wave Transient Catalog” provides a summary of the astrophysical results for the new candidates added in GWTC-5.0. It focuses on the core properties of each event (including parameters such as mass, spin, and distance, among others). Additional analyses that cover broader interpretations of the results will be included in a number of companion papers that will appear alongside, or shortly after, the GWTC-5.0 data release.
The road to 400
We have found 161 new candidates that occurred during O4b that are likely to be astrophysical in origin. All of these events appear to be binary black hole mergers based on what we were able to infer about their masses from the GW signals we detected. Unlike earlier data sets from the previous catalog release, there were no new events involving neutron stars during O4b.
The new events bring the total number of candidates within the GWTC to 390. Of the 161 new candidates, we also provide detailed follow-up analysis on the 104 most significant events. We indicate significance through the ‘false alarm rate’ – a measure of how often we’d expect random noise fluctuations to produce something that looks like a GW signal. We perform follow-up analysis on events with a false alarm rate smaller than one per year.
Exceptional events
Several exceptionally novel events – a number of which have been previously announced – are included in the catalog. Among these are GW250114, the loudest GW signal recorded to date; GW241011 and GW241110, which provided compelling evidence for the existence of ‘hierarchical’ black hole mergers; and GW240925, which was one of two events used in the first informative application of astrophysical calibration. Each of these results has received its own dedicated release, but is nevertheless worth highlighting in the catalog as a noteworthy observation. We summarize each of these exceptional events below, with links to their own dedicated science summaries provided for the curious reader.
- GW250114 – the loudest GW event to date
GW250114 is a record-breaking loud GW signal from a binary black hole coalescence. We measure the ‘loudness’ of GW events via the Signal-to-Noise Ratio (SNR) – effectively the strength of the signal divided by the typical size of noise fluctuations in the detector. The previous record holder, GW230814, had an SNR of 42.4. GW250114 was observed with an SNR of 76.9 (nearly twice as loud), which allowed us to perform rigorous tests of general relativity and confirm the validity of Hawking’s Area Law. Notably, the two black holes that merged (which had masses roughly 34 and 32 times the mass of our Sun) are nearly identical to the ~36 and ~29 solar mass black holes of GW150914, the first ever detection of GWs. What’s more is that these events occurred at roughly the same distance from Earth – 1.3 and 1.4 billion light years, for GW250114 and GW150914, respectively. The massive improvement in SNR came almost entirely from improvements to the detectors themselves, not from anything particularly unique about the source.
- GW241011 and GW241110 – evidence for hierarchical mergers
When two black holes are born from a pair of stars that spent their lives together, you expect their ‘spin’ (intrinsic rotation, separate from their orbital motion) to be at least somewhat aligned with the rotation of the orbit – similar to how most planets in our solar system rotate in the same direction, reflecting their common origin in a single rotating gas cloud. But both GW241011 and GW241110 showed well-measured spins that do not line up the way you would expect, alongside distinctly unequal masses. Together, these are clues that the systems probably formed in a crowded environment like a dense star cluster, where black holes can encounter and capture each other dynamically – and where one of the merging black holes can itself be the leftover of an earlier merger. These events are our best evidence to date for such ‘hierarchical mergers,’ where the products of earlier black hole mergers live on to merge again.
- GW240925 – the first informative use of astrophysical calibration
Detecting GWs requires careful and rigorous calibration of our detectors at the time of each event. In most cases this is well understood, but the calibration status can occasionally be unknown – for example when the detectors have changed state and need time to ‘settle down.’ The universe, of course, is not always kind enough to wait. In the case of GW240925, that’s exactly what happened. The event itself was deceptively typical, the merger of two black holes roughly 9 and 7 times the mass of our sun, but it came at a time when the LIGO Hanford detector was miscalibrated. Thankfully, the signal itself was quite loud (SNR of 31.9), and because GWs from merging black holes are well-understood, we were able to compare our miscalibrated data to theoretical models of how the GWs should appear in the detector. This allowed us to use the signal itself to reverse-engineer the detector calibration. This marked the first time astronomical events were directly used to calibrate our detectors. (A companion event that also made use of astrophysical calibration, GW250207, was published alongside GW240925. However, since it occurred after the conclusion of O4b, it does not appear in GWTC-5.0 and will instead be included in a future update to the catalog.)
The sky (localization) is the limit!
GWTC-5.0 also sets a new record for precision GW astronomy with vastly improved localizations for several events. To understand why this is noteworthy, we first need to understand how GW detectors pinpoint the location of events. A single GW detector on its own can tell you if a GW event occurred, but it cannot necessarily tell you where in the sky it occurred. (At best, it can tell you where it was not by ruling out the few directions in which the detector is effectively blind.) But when two detectors capture the same signal, we are able to compare the precise time that the signal appeared in each detector and use that – coupled with the fact that GWs travel at the speed of light – to triangulate where the signal might have come from in a way that is very similar to how your phone uses the timing of GPS signals to tell you where you are on Earth. When there are three (or more) detectors observing, we can then perform this triangulation multiple times (once for each unique pair of detectors), significantly improving our ability to determine where the event happened in the sky.
In O4a, only the two LIGO detectors were online and actively observing, which fundamentally limited our ability to localize GW events. But Virgo joined the observing run for O4b, which gave us a third detector in the network. This massively improved our precision, and there is no better example of this than GW240615_113620 – the best localized GW source observed to date – with an area of only 6 square degrees – roughly the patch of sky your thumb covers when held out at arm’s length. For comparison, the best localization achieved in GWTC-4.0 was 110 square degrees – nearly twenty times less precise – with many other events spanning thousands (or even tens of thousands) of square degrees of the sky.
To GWTC-5.0 and beyond!
GWTC-5.0 marks another significant milestone in our exploration of the GW universe. In just over a decade since the first detection of GW150914, we have moved from a single confirmed signal to a catalog of nearly 400. With each and every observing run we expand what we know about the populations of black holes and neutron stars hiding in the cosmos.
Find out more:
- Visit our websites:
- Read free preprints of the GWTC-5.0 scientific articles:
- Introductory paper: https://dcc.ligo.org/LIGO-P2500701/public/
or on arXiv: https://arxiv.org/abs/2605.27223 - Methods paper: https://dcc.ligo.org/LIGO-P2600166/public/
or on arXiv: https://arxiv.org/abs/2605.27224 - Results paper: https://dcc.ligo.org/LIGO-P2600152/public/
or on arXiv: https://arxiv.org/abs/2605.27225
- Introductory paper: https://dcc.ligo.org/LIGO-P2500701/public/
Back to the overview of science summaries.