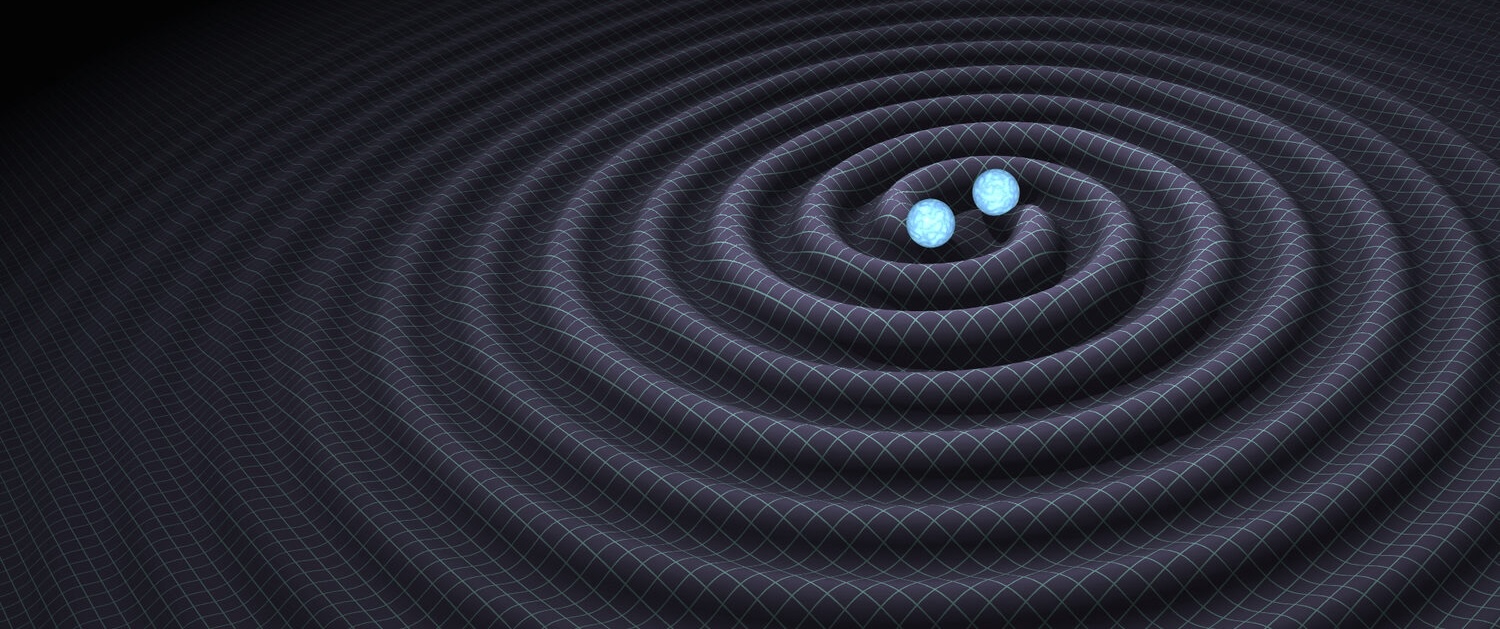
During its first observing run, the Advanced Laser Interferometer Gravitational Wave Observatory (LIGO) detected gravitational waves from merging black holes on two separate occasions. The number of events observed during this run indicates that black holes merge more often than we anticipated. There is no reason to believe these events were special occurrences, and we expect many more events to be occurring frequently throughout the universe. Although many of these events will be too far away or too faint to be detected by Advanced LIGO individually, they will all contribute to a background of gravitational waves. Other gravitational wave (GW) sources such as rapidly rotating neutron stars, other compact binary mergers (which include neutron stars and black holes) and gravitational waves emitted at the formation of the universe, during the Big Bang, will also contribute to the stochastic (random) background signal.
Another example of such a background signal, known as the Cosmic Microwave Background (CMB), is commonly observed in microwave astronomy. When the CMB was first discovered, the intensity of the background radiation was, at first, measured to be isotropic (ie. the same in all directions). However, more sensitive and detailed observation later revealed a more complicated structure, known as the CMB anisotropy.
We search data from Advanced LIGO’s first observing run and look for similar anisotropy in the gravitational wave background. To investigate this directional structure, we project our results onto a map of the sky. Distant individual sources may appear point-like, but many nearby point sources will combine to produce an extended pattern that covers a larger patch of the sky. We use an approach known as radiometry to search for a background of point-like, as well as extended sources, across the sky. A separate search also looked for a so-called isotropic background in Advanced LIGO data.
Although we didn’t detect a gravitational wave background, our skymaps tell us how energetic the gravitational wave sky would need to be in order for us to detect it. We present upper limit maps of the energy flux from GW point sources on the sky that would be detectable by Advanced LIGO. We also present upper limit maps of the energy density of extended sources across the sky. For interactive sky maps showing the results of the search for extended sources in the gravitational wave background see here. In our search we include the possibility that the background is dominated by compact binary mergers. For a map of the signal-to-noise ratio from the search for point sources in a background of binary mergers see Figure 1. Our results from Advanced LIGO’s first observing run are around 10 times more sensitive than similar search by initial LIGO.

This map shows the radiometer signal-to-noise ratio for each point on the sky when looking for a GW background dominated by compact binary mergers. The values detected are not significant, and are consistent with the natural variations in measured SNR from a sky that contains purely noise.
We also look for point sources in specific directions on the sky associated with interesting astronomical objects for which electromagnetic observations indicate the presence of potential persistent GW emitters. We present limits on the amplitude of persistent gravitational waves as a function of gravitational wave frequency. We point in the directions of the Low Mass X-ray Binary Scorpius X-1, Supernova 1987A and the Galactic Centre. Again, our limits are more than 10 times better than previous results at low frequencies (below 50 Hz) and high frequencies (above 300 Hz).
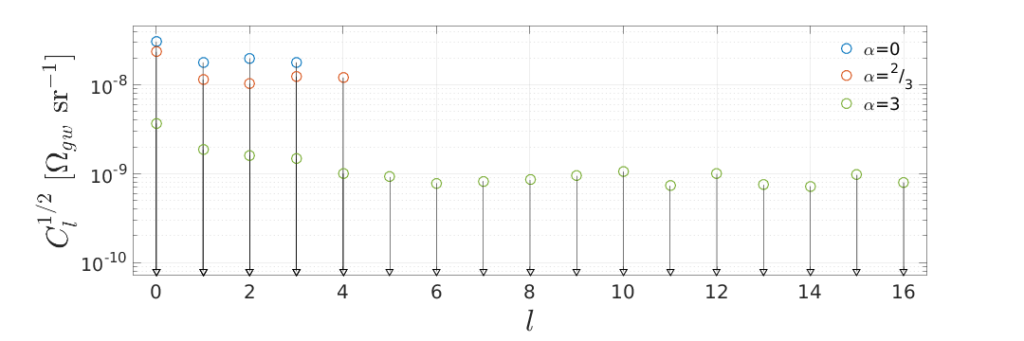
This figure shows upper limits on the scale of the angular spot size on the sky for three different models of the gravitational wave background (as characterized by the dimensionless number α). The horizontal axis corresponds roughly to the angular spot size, with larger spots represented on the left of the figure and smaller spots on the right. These limits indicate the strength of the variations in energy density, as a function of spot size, that are consistent with the Advanced LIGO data. We can see that, for these models, the variations are less than roughly one part in ten million for larger spots, dropping to about one part per billion for smaller spots.
Our skymaps provide a useful tool to visualise the energy density of the gravitational wave sky. Finding structure in the gravitational wave background could uncover a richer, and even more exciting, infant universe. Also, scanning the gravitational wave sky, while making minimal assumptions about the type of signals we are looking for, could help us find things that we were not expecting.

This figure shows upper limits from the search for point sources in the directions of Sco X-1 (left), Supernova 1987A (middle) and the Galactic Centre (right) as a function of frequency for the O1 observing run. The upper limits are represented by the gray band and indicate the signal strength our search would be sensitive to. The standard deviation is indicated by the black line.
Read more:
- arXiv preprint of the paper describing the details of the full analysis and results.
- interactive sky maps showing the results for the search for extended sources in the gravitational wave background
- search for an isotropic background
- results from previous directional search in initial LIGO