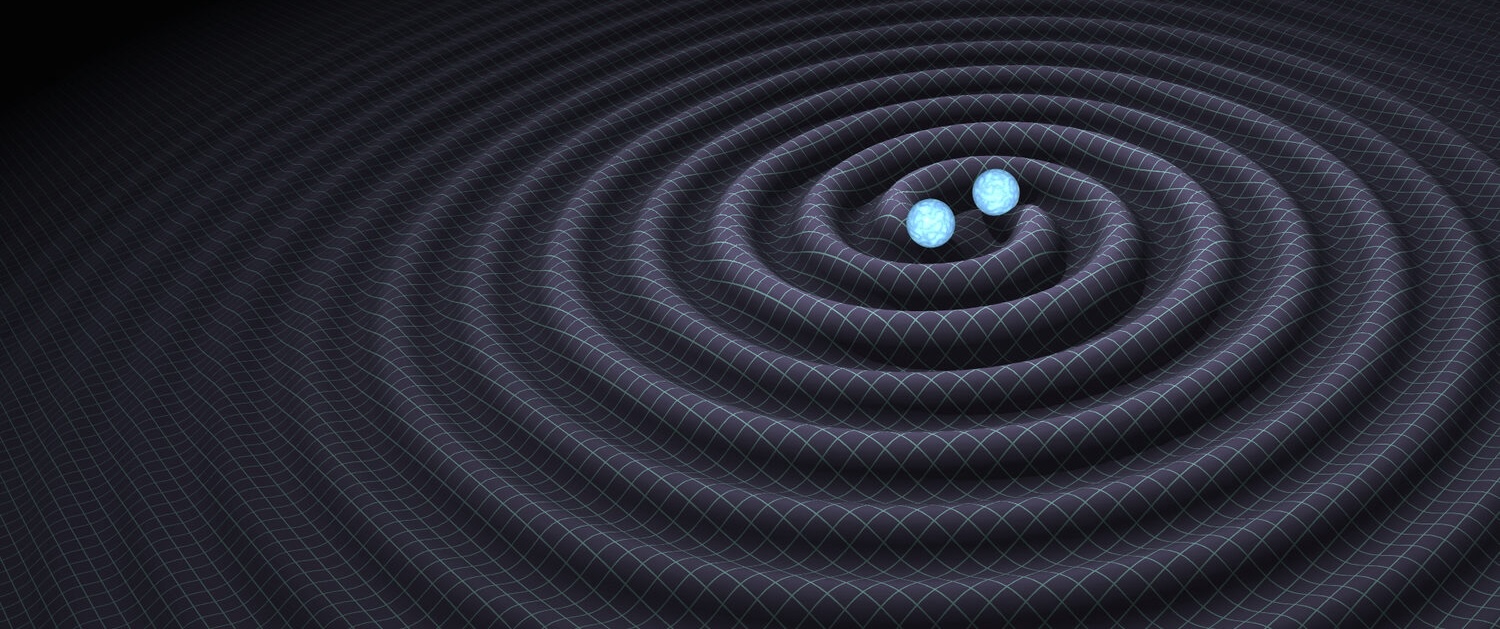
The GW170814 event is the fourth confirmed detection of gravitational waves reported by the LIGO Scientific Collaboration and Virgo Collaboration. The signal comes from a coalescing pair of stellar-mass black holes, and is the first to be observed by the Advanced Virgo detector. This detection illustrates the enhanced capability of a three-detector global network (comprising the twin Advanced LIGO detectors plus Advanced Virgo) to localize the gravitational-wave source on the sky and to test the General Theory of Relativity. GW170814 therefore marks an exciting new breakthrough for the emerging field of gravitational-wave astronomy.
Introduction
On August 1, 2017, the Advanced Virgo detector joined the Advanced LIGO second observation run (O2), which ran from November 30, 2016 until August 25, 2017. On August 14, at 10:30:43 UTC, a transient gravitational-wave signal, now labelled as GW170814, was detected by automated software analyzing the data recorded by the three Advanced detectors. The signal was found to be consistent with the final moments of the coalescence of two stellar-mass black holes. Subsequent analysis using all the information available from all three detectors showed clear evidence of the signal being present in the Advanced Virgo detector. This makes GW170814 the first confirmed gravitational-wave event to be observed by three detectors.
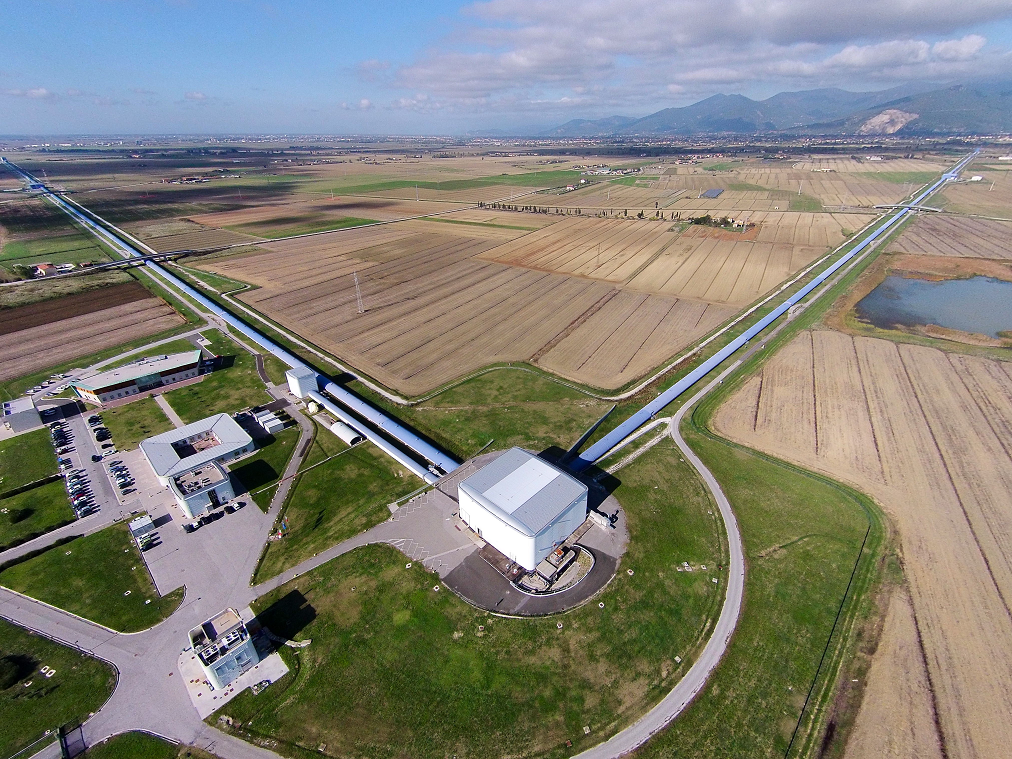
Aerial view of the Virgo gravitational-wave detector, situated at Cascina, near Pisa (Italy). Virgo is a giant Michelson laser interferometer with arms that are 3 km long. (Image credit: Nicola Baldocchi / Virgo Collaboration)
Detectors and data quality
The LIGO and Virgo detectors are giant Michelson laser interferometers with arms 4 km and 3 km long respectively. The LIGO detectors are located in the USA, at Hanford, WA and Livingston, LA, while Virgo is located in Italy, at Cascina, near Pisa. These three detectors were designed in the 1990’s, built around the year 2000 and operated the following decade in their initial configuration—alongside the GEO600 instrument, located in Germany. LIGO and Virgo have undergone a significant multi-year upgrade program aimed at improving their sensitivity by about a factor 10 (thus increasing the volume of the Universe probed for a given source by a factor of 1000).
The LIGO upgrade program started in 2010 and was completed in 2015, allowing the first LIGO observation run (O1) to start in September of that year—with the first gravitational-wave event detected a few days later. Two more confirmed detections followed in December 2015 and January 2017 (in O2).
The Virgo upgrade program started a year later in 2011, with the whole apparatus—from the mirrors and vacuum systems, to the photodiodes sensing the laser beams—being improved. After about a year of commissioning, Advanced Virgo joined O2 on August 1, 2017. Although the LIGO and Virgo detectors use the same method (interferometry) to detect gravitational waves, and share many common design features, they have been built and operate completely independently.
Figure 1 compares the typical sensitivity curves achieved by the three detectors around the time of the GW170814 event. The data were then cleaned using well-identified noise sources which contaminate the strain sensitivity in a known way1. Extensive checks of the environmental and instrumental status at all three sites showed no indication of any problems.
1. The same principle is used by noise-cancellation headsets which sense the ambient noise using probes located on the device and remove that noise by sending the “opposite” signal to the ears.
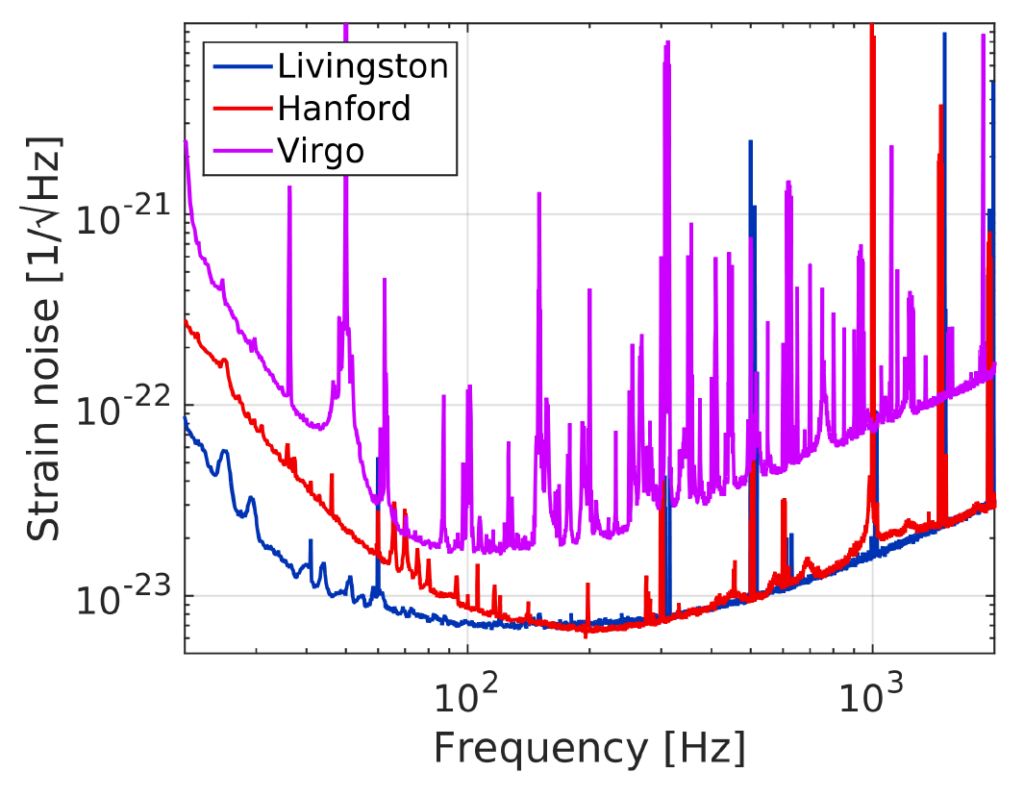
Figure 1: This figure (which is Figure 2 in our publication) compares the sensitivity (labelled “Strain” on the vertical axis) of the three detectors as a function of frequency (in Hertz, on the horizontal axis). Note that both axes have a logarithmic scale. At a given frequency, the lower the sensitivity shown on the graph, the weaker the gravitational-wave signal that can be detected. The blue curve shows the sensitivity of LIGO Livingston, the red curve is for LIGO Hanford, and the purple curve is for Virgo.
The observed GW170814 signal
The identification of a new transient gravitational-wave event follows several steps. For GW170814 the first step took place right after the data acquisition and employed so-called low-latency pipelines which use matched-filtering techniques to look for coincident “triggers” (i.e., candidate signals) in the Advanced detectors.
GW170814 was observed by Advanced LIGO at high statistical significance within 30 seconds of its arrival; an alert was generated and sent out to the various telescope partners of the LIGO-Virgo Collaboration. Later, the significance of the candidate detection was computed more accurately, using about six days of LIGO coincident data and a procedure similar to those used for the previous confirmed detections. This more detailed analysis allowed computation of the false alarm rate associated with the event, i.e., how often one might expect to see pure noise fluctuations in the two detectors conspiring to produce an apparent signal at least as strong as the one observed. With GW170814, the false alarm rate was found to be lower than 1 in 27,000 years, making the detection case rock-solid.
Virgo also saw this gravitational wave event, as demonstrated by two independent analyses. The first one, based on matched filtering, compares two models: one assumes that GW170814 is a binary black hole merger observed in all three detectors (i.e., with Virgo included) and the other assumes a binary black hole merger signal in the two LIGO detectors and only pure noise in Virgo. Our computations found that the former model was more than 1600 times more likely than the latter. The second method searches for unmodeled gravitational-wave transients with a frequency that increases with time—i.e., like the chirp signal produced by the merger of two compact objects but without assuming that particular waveform shape—and combines the data from multiple detectors to reconstruct the waveform. For all of the confirmed gravitational-wave detections to date, the waveforms reconstructed using this unmodeled approach match the binary black hole merger model very well.
Two different unmodeled reconstructions were compared for GW170814—one using only the two LIGO detectors and the other based on the three-detector network. Again, the strength of the reconstructed signal can be converted into a false-alarm rate, stating the frequency at which independent noise fluctuations would produce a signal at least as large. Using only two detectors, the computed false-alarm rate was approximately 1 in 300 years; with the full network, the rate was reduced to lower than 1 in 5,700 years. Hence, the three-detector case is again clearly favored over the two-detector hypothesis. Figure 2 shows three different ways of looking at the data recorded by the three interferometers at the time when GW170814 was detected.
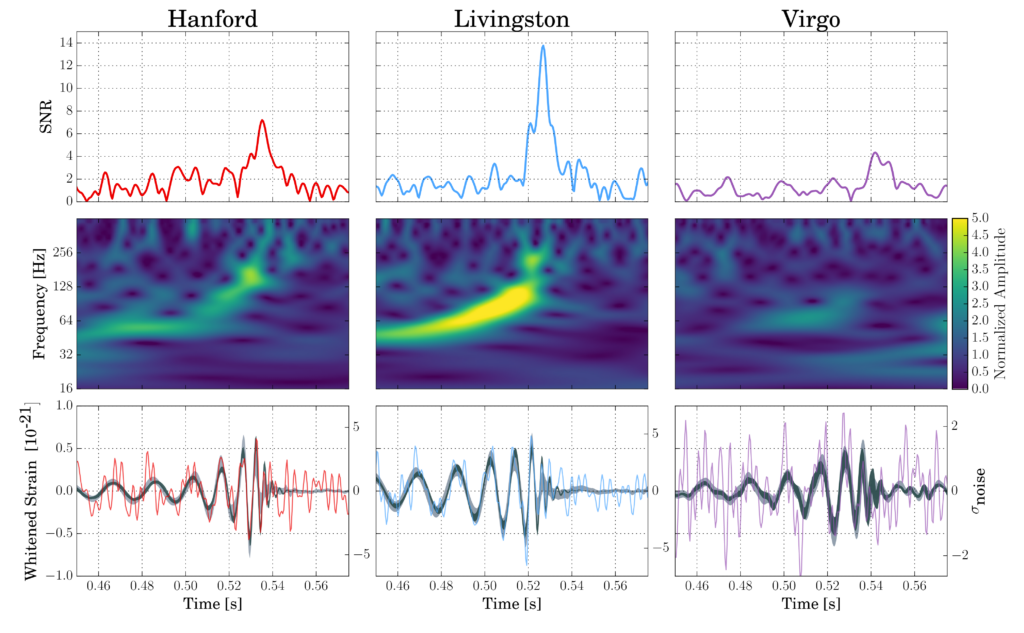
Figure 2 (which is Figure 1 in our publication): Top row: Signal-to-noise ratio as a function of time. The peaks occur at different times in different detectors because gravitational waves propagate at the finite speed of light; this causes the signal to reach the detectors at different times. GW170814 arrived first in LIGO-Livingston, then 8 ms later in LIGO-Hanford and 6 ms after that in Virgo. Middle row: Time-frequency representation of the strain data. The brighter a given pixel in any of the three 2D-maps, the larger the signal at this particular time and frequency with respect to the expected noise level. Note the characteristic “chirp” pattern of increasing frequency with time. Bottom row: Strain time series with the best waveforms selected by the matched filtering (black solid curves) and unmodeled search methods (gray bands) superimposed.
Source localization of GW170814
The localization of a source in the sky can be estimated using the differences between the arrival times of the gravitational-wave signal in the various detectors of the network. These differences are due to the finite value of the speed of light, which introduces a delay of up to 10 ms for the two LIGO detectors that are about 3,000 km apart. Assuming the arrival times are known perfectly, each time difference will be associated with a circle in the sky, indicating the sky positions with which it is consistent. With a three-detector network, one obtains three time differences and hence three circles, which intersect in two points2.
In reality, the arrival times have uncertainties, which means that the circles are in fact bands with a particular thickness that is determined by the timing uncertainties; the intersection of these bands marks out the area on the sky within which the gravitational-wave source is localized. To improve the source localization further, the amplitude and shape differences between the signals detected in the network can also be used. To understand this, it is best to think of a gravitational-wave interferometric detector as more like a microphone than a telescope, in the sense that it can be sensitive to signals coming from most directions, although with some limitations. For example, a gravitational wave coming from directly above or below the plane of the instrument arms would be seen best, whereas the same wave coming exactly along the bisector of the arms would be completely invisible. Generally speaking, the higher the source over the local horizon, the better the detector response, and each instrument has four blind spots, all located in the plane of the arms. If a gravitational wave is not detected by an instrument which is in principle sensitive enough to see it, that means that the signal is coming from the direction of one of these blind spots.
Figure 3 summarizes the localization of the GW170814 source in the sky provided by successive data analysis methods: initial rapid localization with only the two LIGO detectors shown in blue, addition of Virgo shown in orange, and results of the full parameter estimation (see below) shown in green. The network can also constrain the distance to the source, as shown in the right-hand plot of Figure 3. This shows that the localization of the source is carried out in three dimensions. In favorable cases, the most credible volume might only contain a limited number of galaxies which would simplify the search for a visible counterpart by partner telescopes. Follow-up observations of GW170814 were made by twenty-five observatories, but no counterpart could be identified. However, binary black hole mergers are not expected to produce any emission apart from gravitational waves.
2. With four or more detectors, all circles intersect in a single point. This is one of the reasons why adding a fourth interferometer (KAGRA in Japan) by the end of this decade and a planned fifth detector (LIGO India) a few years later will enhance even further the localization power of the global network.
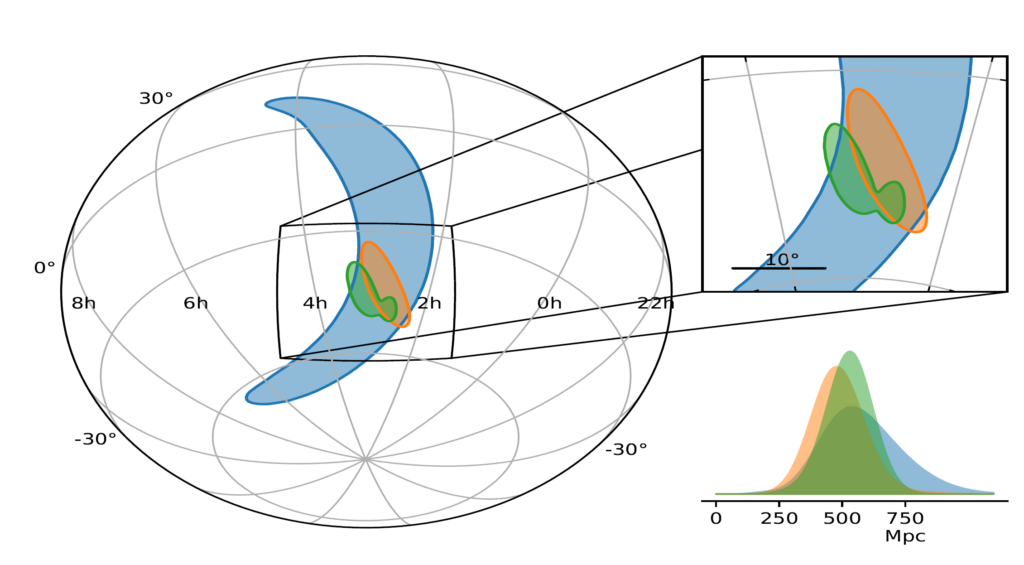
Figure 3: Localization of GW170814’s source on the sky. The left part of the figure compares the sky regions selected by the different analyses as the most likely to contain the source of the GW170814 signal. These are called 90% credible regions as they are defined such that the probability that they include the source is equal to 90%. The blue area corresponds to the rapid localization based on data from the two LIGO detectors only. Adding Virgo leads to the orange area, which is more than one order of magnitude smaller, 100 square degrees compared to 1160 square degrees. The green region is the result of the full parameter estimation analysis using all three detectors—an area of 60 square degrees. This can be compared with the area of 700 square degrees computed for the full parameter estimation using only data from the two LIGO detectors. The right part of the figure compares the probability distributions for the luminosity distance of the source. Adding Virgo narrows this distribution by cutting away the tail corresponding to large distances, with the most likely distance of about 540 Mpc.
Measurement of the GW170814 parameters
The parameters of GW170814 were estimated using the same techniques employed in the other confirmed detections: the detected signals were compared to two independently developed families of model waveforms, the characteristics of which depend on the parameters being measured. The better that the waveform generated for a given set of parameters matches the signals, the closer these parameters should be to their true values.
Full details of the measured GW170814 source parameters can be found in our publication or in the GW170814 factsheet. For example, Fig. 4 shows the parameter constraints inferred on the masses of the primary black holes.

Figure 4 (Upper panel of Figure 4 from our publication): Masses (expressed in units of the solar mass) of the two initial black holes for the GW170814 event. These masses are estimated simultaneously and the resulting joint mass constraints are shown in the m2 vs. m1 plane (where the convention that m2 ≤ m1 is used) the darker the color, the higher the probability that the black hole masses are equal to that pair of (m1,m2) values. The black contours show the 50% and 90% credible regions respectively. In addition, one-dimensional probability distributions for the mass of each individual black hole are shown in gray on both axes. The most likely masses for the two black holes are about 30 and 25 solar masses respectively.
Testing general relativity with GW170814
Tests of General Relativity have been performed for GW170814; these tests are similar to those carried out for the previous confirmed detections—with similar results that are again consistent with the predictions of Einstein’s theory. More in-depth analyses will be carried out in upcoming publications.
Operating a network that comprises detectors which have different orientations (the two LIGO instruments are almost co-aligned, but Virgo is not) also allows one to study the polarization of the gravitational waves, i.e., the way in which gravitational waves distort spacetime when they propagate through it.
General Relativity predicts that gravitational waves are transverse. This means they stretch and squeeze spacetime in the plane perpendicular to their direction of travel. The allowed distortions come in only two types, called “+” (“plus”) and “×” (“cross”) polarizations. Their effect on a ring of particles is shown in panels (a) and (b) of Fig. 5.
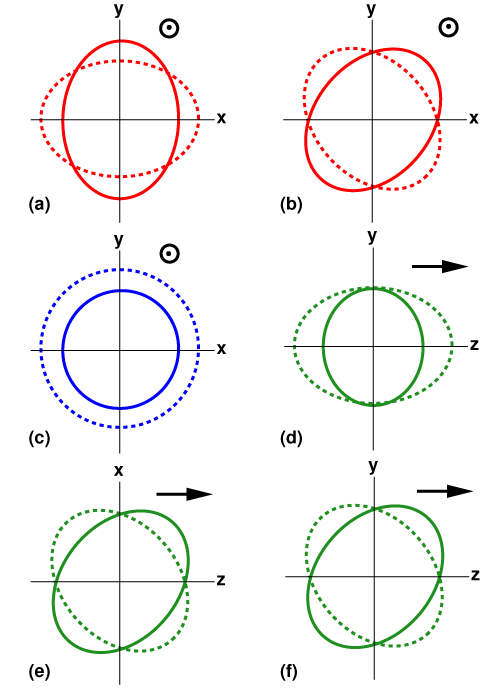
Figure 5: Representation of the six polarizations permitted in general “metric” theories of gravity. Panels (a) and (b) denote, respectively, the “+” and “×” polarizations permitted by general relativity. In these two cases, the spacetime distortion is in the plane perpendicular to the direction in which the gravitational wave travels (i.e. out of the page): an initially circular ring of particles is stretched in one direction in this plane while being squeezed in the perpendicular direction in the plane, before the pattern reverses. Panels (c) to (f) denote polarizations that are not permitted in general relativity. Panel (c) again shows a transverse polarization, while panels (d) to (f) illustrate distortions that propagate in a direction (shown by the arrow) that lies in the same plane as the spacetime distortion. (Credit: Clifford Will, Living Reviews in Relativity)
Mathematically speaking, a generic so-called “metric” theory of gravitation can accommodate up to six different polarizations, including the two allowed by General Relativity. Any additional polarization state would distort spacetime in a different way, which would change how an interferometric detector responds to such a signal. This behavior would reveal itself when comparing the signals detected in two non-parallel instruments, as their differences could not then be accounted for by general relativity. Panels (c) to (f) of Fig. 5 show the effect of these other polarizations. While panel (c) again denotes a transverse wave, propagating out of the plane of distortion, panels (d) to (f) denote gravitational waves propagating in the same plane as the spacetime distortion—as indicated by the arrow in these cases.
A first test of gravitational-wave polarization was carried out using the GW170814 data. The full parameter estimation analysis described above was performed again, this time assuming different gravitational-wave polarizations that are forbidden by General Relativity. All the alternative polarization combinations tested in this way are disfavored by this analysis, again indicating that our GW170814 data are consistent with Einstein’s theory.
Conclusions
GW170814 is the fourth binary black hole merger to be confirmed by the LIGO Scientific Collaboration and Virgo Collaboration. The black holes identified have similar masses to those from the first (GW150914) and third (GW170104) detection; they are consistent with the astrophysical populations and merger rates inferred from the previous detections.
This event is quite unique as it is the first detection made by three detectors: the two Advanced LIGO interferometers and Advanced Virgo. A three-detector network has enormous scientific potential, and this has been well-illustrated by GW170814 with its much-improved localization, in terms of both sky position and distance, and suitability for carrying out additional tests of general relativity. With the third LIGO-Virgo observing run, “O3”, scheduled to start in 2018, the prospects for gravitational-wave astronomy look exceedingly bright.
Find out more:
- Visit our websites: http://ligo.org, http://www.virgo-gw.eu
- You can read the full article, which has been accepted for publication in Physical Review Letters, here.

