Brilliant flashes of light in the dark
Gamma-ray bursts (GRBs) are the brilliant flashes of high-energy light that arise from the universe’s most energetic stellar death events. These phenomena, which erupt in an initial bright flash and then glow for many months, occur at the end of life for certain exotic astronomical bodies. GRBs are roughly categorized into two types: short GRBs, whose gamma ray flashes last only for a second or two, can occur when two neutron stars crash into each other; long GRBs, which emit gamma rays for as long as thousands of seconds, are thought to instead to be caused by the collapse of stellar cores inside certain types of massive stars. When viewed with satellites and telescopes that are sensitive to light, both types of GRBs are first observed with gamma rays and then gradually across the entire electromagnetic spectrum as their brilliant fireballs expand and cool. But far from being interesting purely due to the light that we see, they are also amongst the most intriguing astronomical events for gravitational wave study.

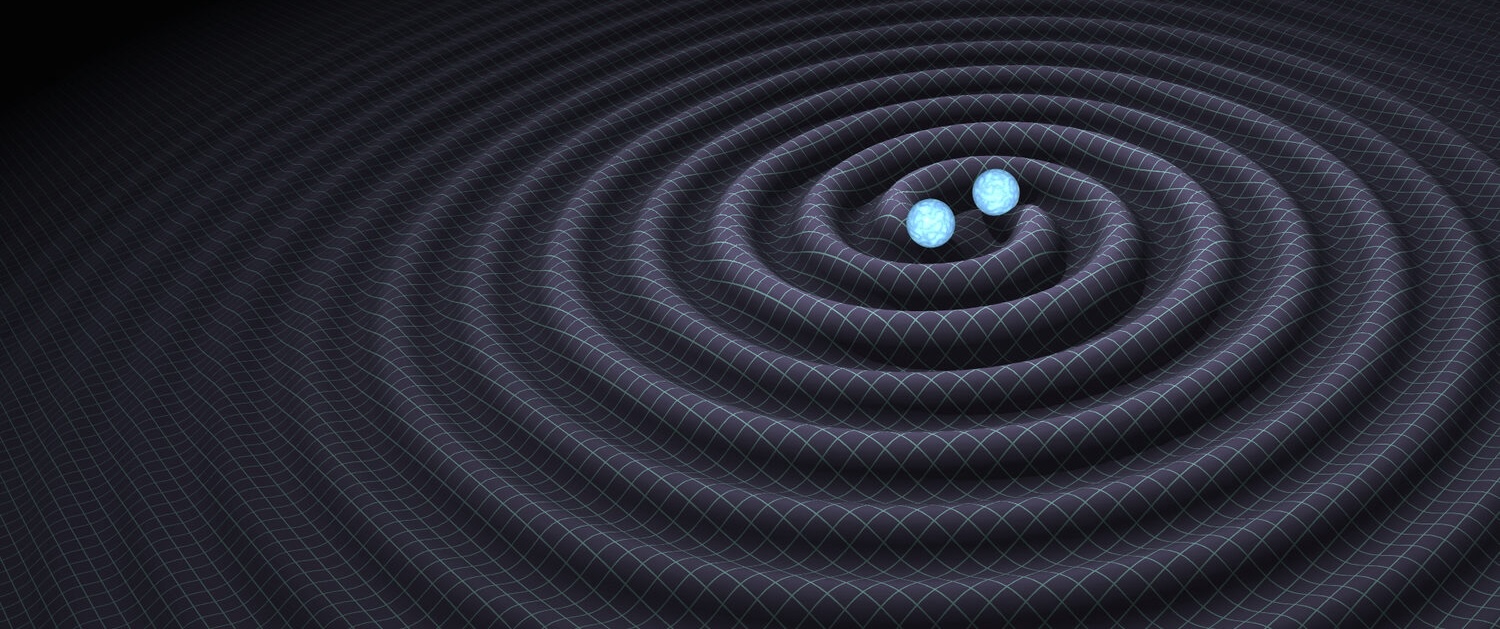
Artist’s illustration of two merging neutron stars. The narrow beams represent the gamma-ray burst while the rippling spacetime grid indicates the isotropic gravitational waves that characterize the merger. Credit: National Science Foundation/LIGO/Sonoma State University/A. Simonnet.
There is a lot that we are able to learn simply by looking at GRBs with our telescopes. The gamma ray light we see tells us about the energy of the event that produced them, the X-ray light we see informs us how they evolve, all the way down to the radio waves that tell us what they leave behind. But there are many things that light alone can’t probe, such as what is happening deep at the heart of these catastrophic events. This is because light is easily obscured in spite of all its other observational strengths. Consider that you need only hold up your hand to shield your eyes from the Sun’s light. The light from GRBs can be similarly obscured by the very material that they themselves expel during the explosion! More than that, the gamma ray light that is emitted by GRBs is packed into a narrow, highly focused jet of material. We only see them if they happen to be facing us!
That’s where gravitational waves come in. This exciting new branch of astronomy offers a new way to observe these phenomenally interesting events. Light is emitted from the surface of objects, but gravitational waves are connected directly to the dynamic motion of mass and energy inside the object. Moreover, gravitational waves are all but impossible to obscure. And since GRBs are such violent and energetic events that involve highly massive compact objects like neutron stars and stellar cores, they are prime candidates for gravitational wave emission! That means gravitational waves allow us to probe GRBs in new and complementary ways that light alone cannot.
How we look for gravitational waves from GRBs
The two broad categories of GRBs (short and long) require very different considerations when searching for gravitational wave signals that may be associated with them. In the case of short GRBs, they can arise from binary neutron star systems (or, perhaps, systems made of a neutron star and a black hole, rather than two neutron stars) that we are able to model very effectively. This precise modeling allows us to use extremely sensitive search techniques that leverage those model predictions to improve our chances of detecting the signals. We call the process of searching our data for gravitational wave signals using these techniques “modeled searches.”
At the other extreme, long GRBs are thought to begin with the collapse of an extremely heavy stellar core into a neutron star or a black hole. But the collapse of the core is then followed by a complicated period of electromagnetic and gravitational wave emission as the remains of the star that were not expelled in the initial burst fall back toward the central compact object. These complex systems are difficult to model, which limit our ability to use our most sensitive techniques when searching for their gravitational wave emission. So we instead use techniques that require minimal assumptions about the nature of the signal (we call these “unmodeled searches”). What these techniques lose in sensitivity, they make up for in the ability to detect many different types of gravitational wave emission!
The results we describe here summarize our findings for gravitational wave emission from all the GRBs that were detected by the Swift and Fermi satellites during LIGO’s second observing run (which we call “O2” for short). This is not the first time LIGO has published such a search (see our O1 GRB search, as well as other earlier searches). But unlike past efforts to detect gravitational waves from GRBs, which did not produce direct detections, the O2 search marks the first time we are able to claim a confident detection!
A tale of two signals
Towards the end of the second observing run in August of 2017, shortly after a freshly-upgraded Virgo had joined LIGO’s observing efforts, a fascinating signal appeared in our detectors. This gravitational wave signal, named GW170817 (for the date that it occurred, August 17th, 2017) showed up clearly in LIGO detectors (and very, very faintly in Virgo). Remarkably, just two seconds after the gravitational wave signal was detected, the flash of a GRB was detected in gamma ray satellites like Fermi/GBM and INTEGRAL. This electromagnetic signal, GRB170817A, came from the same tiny corner of the cosmos as the gravitational wave detection. They were two different signals from the same cosmic event, one in gravitational waves and one in gamma rays. It was the first “multi-messenger” observation of a gamma-ray burst!
The results of the subsequent analysis, which included efforts by LIGO, Virgo, and over 70 astronomical observing partners, is well documented. You can see for yourself by checking out our numerous science summaries of the event! It opened a whole new world of discovery, and answered many long-standing questions. It proved conclusively that (at least some) GRBs are caused by binary neutron star mergers, and confirmed predictions that those events would likely be short. It allowed us to measure the rate of expansion of the universe and compare the speed of gravity to the speed of light (spoiler: they’re the same). And subsequent multi-messenger observations showed that events like this one help explain the origin of the universe’s heavy elements like gold. All of these fascinating results were enabled by the fact that we were able to detect this event both with telescopes and gravitational wave detectors.
The GRB-focused analysis we describe here was able to clearly and definitively detect GW170817 using both modeled and unmodeled searches, and our findings are entirely consistent with those that were previously published. Not only is this further evidence of the value of studying GRBs in this way, but it was an excellent test of the techniques we use to do so!
A lot more GRBs…
But GRB170817A wasn’t the only GRB that occurred during our second observing run. In total, from November 2016 through August 2017 there were 242 GRBs that we studied in exactly the same way! But not all of those GRBs occurred at times when gravitational wave data were being taken. Additionally, the data our detectors produce contain complicated features even when there are no gravitational wave signals to detect. (In fact, many things besides gravitational waves can produce variations in our data, for example: earthquakes, winds, ocean waves, traffic, farming activities, even molecular vibrations in LIGO’s mirrors!) The behavior of this ever-present “background noise” further limited the number of events we were able to analyze. Of the 242 total GRBs, we had sufficient high-quality data to analyze 98 events, all of which were studied with unmodeled searches and 42 of which were further analyzed with modeled searches.
Consistent with past searches of this type, we didn’t find any additional gravitational waves signals other than the one from from GW170817, and the GRB we saw with it, GRB170817A. This is not entirely surprising. GRB170817A was unique in that it was very close-by, only ~140 million light years from Earth. (That’s just across the street, in astronomical terms!) Most GRBs are much farther away (on average, trillions of light years once you account for the expansion of the universe) and their gravitational waves are therefore much more difficult to detect. None the less, we are able to draw important conclusions about the 97 GRBs that did not produce a detectable gravitational wave signal. At the very least: that they weren’t close by! The plots included in this summary show the so-called “exclusion-distance” for our total sample, which for a given distance is a way of saying “we are confident that these GRBs were at least that far away.” We do so for several different models of gravitational wave emission, including binary neutron star mergers, mergers of a neutron star with a black hole, as well as two families of signal models that seek to approximately describe emission due to core-collapse in long GRBs.

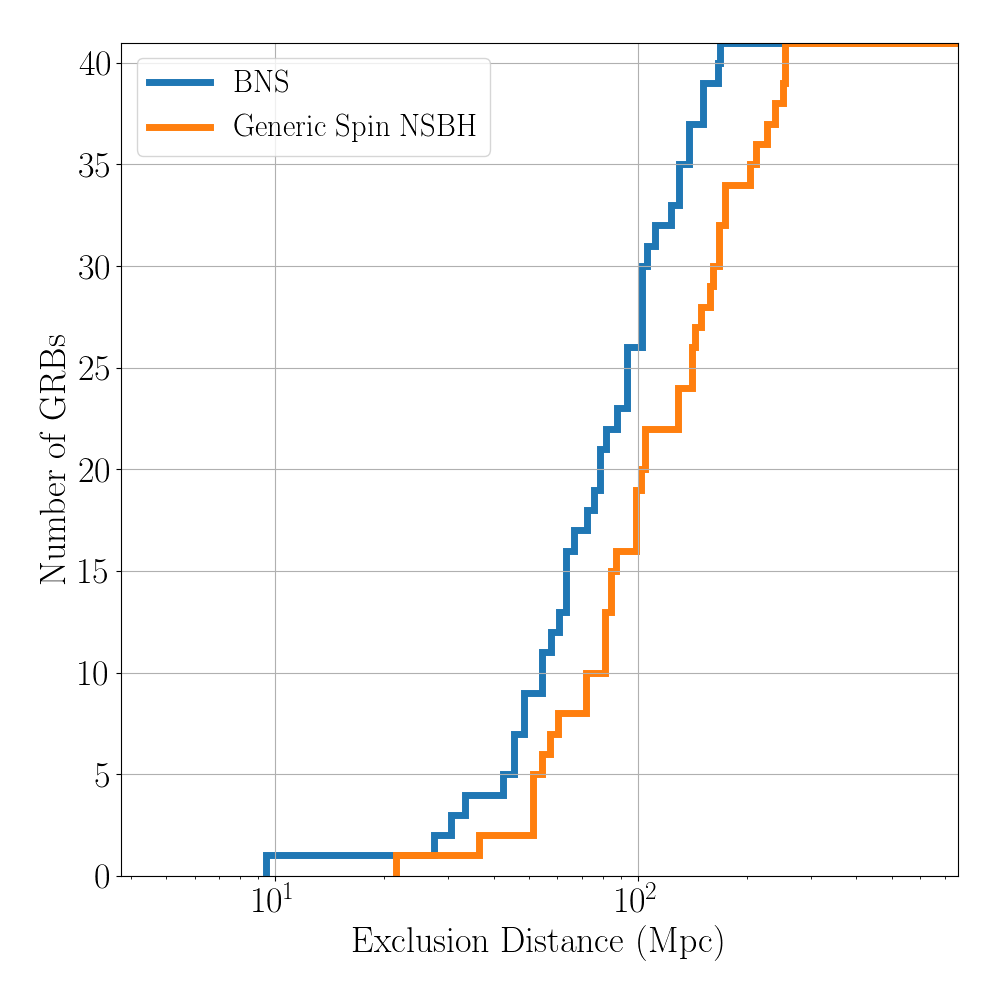
The first two figures show the “exclusion distances,” first for the modeled search, then the unmodeled search. These plots capture the “physical” results of our search, allowing us to make statements like “we are confident that the GRBs we measured were at least a given distance from us.” They were generated by hiding simulated signals in our data at many different strengths (to correspond to different distances). The colored lines represent the distances at which 90% of these “injected” signals were recovered.
Each search type has exclusion distance plots for two signal types. The modeled search shows binary neutron star mergers (blue) and neutron star/black hole mergers (orange). Their median exclusion distances are 80 and 105 megaparsec, respectively. (A megaparsec is a unit of distance, equal to 3.2 million light years.) The unmodeled search shows exclusion distances for a specific type of instability that could occur in accretion disks (blue) and a theoretical “circular sine-Gaussian” (orange) model that represents a “generic burst” of gravitational waves. Their median exclusion distances are 32 and 81 megaparsec, respectively.
But we didn’t stop at searching for obvious gravitational wave signals, we delved deeper into the data to see if there were any signs of events that were too weak to pass our thresholds for detection. These “sub-threshold” signals might appear when GRBs occur just outside the range of our detectors, such that they are too weak to register as clear signals in our analysis pipelines. We search for subthreshold signals with sophisticated statistical tools that compare candidate events to the expected behavior of our gravitational wave detectors, and make a judgement call about whether they are better explained by noise artifacts or the presence of a subthreshold signal. The result of this analysis produced no evidence for any such subthreshold signals in the data from this observing run.
All of these efforts together give us a more complete view of gamma-ray bursts and the gravitational wave signals they may produce. This, in turn, allows us to estimate how often we expect these events to happen. For the third observing run (O3), which is set to run from 2019 through 2020, we expect to detect anywhere between 1 and 30 binary neutron star mergers. (In fact, as of this writing, we think we might have already found one!) Those numbers will get better as scientists work to improve both LIGO and Virgo, and by the time they reach their final “design sensitivities” we could detect anywhere between 4 and 97 binary neutron star mergers per year! (That could be as often as once every few days!) But not all of those will be accompanied by a detectable GRB. The likelihood of joint detection of a gravitational wave event and a GRB (as was the case with GW170817) is much smaller, as it requires some luck for the GRB to be pointed in such a way that we can see the gamma rays from the tightly-focused jet. We expect fewer than two joint-detections in our third observing run, but could be as high as three or four joint-detections per year at design sensitivity.
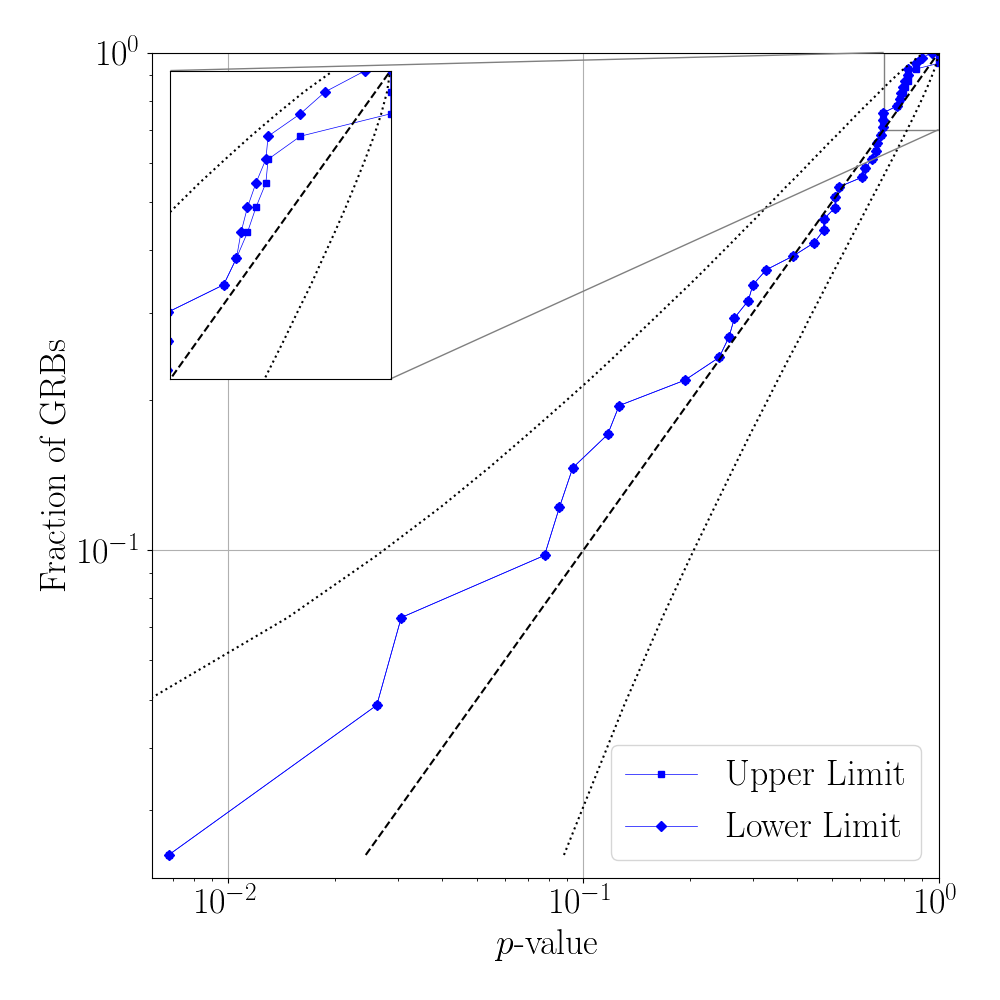
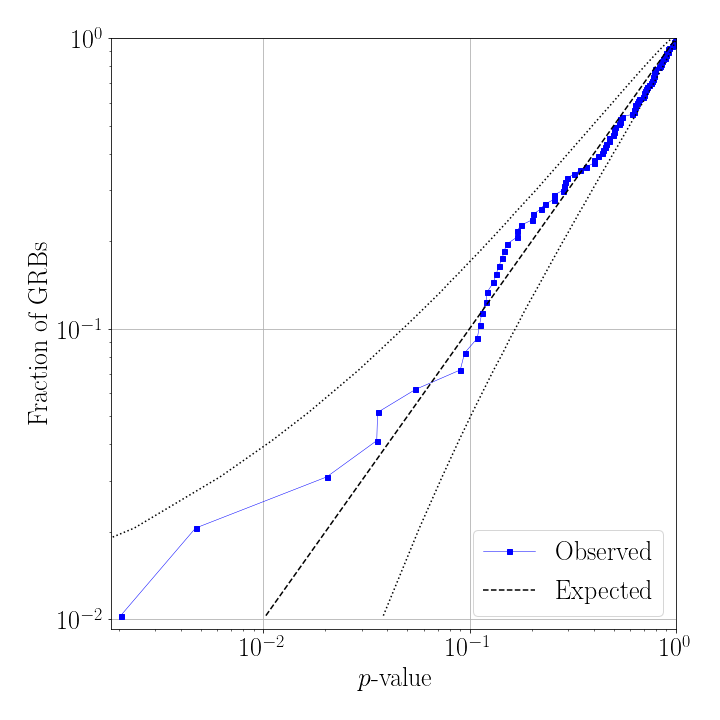
Whereas the first two figures represent our physical results, the next two figures summarize the statistical results. These plots encapsulate the underlying statistical principles that allow us to measure confidence in our results. In short, any time we search for an event our data analysis tools produce a measure of statistical significance called a “p-value.” These plots show the fraction of GRBs in our sample (the vertical axis) as a function of the p-value. We can see that most GRBs have high p-values, which means that most of our results are consistent with being background noise.
But you may also notice that a small fraction of GRBs have low p-values. This does not necessarily mean that those events were produced by gravitational waves! This is because the background noise of our detectors is random in nature. Even though most of the time you’d expect the background to produce high p-values, sometimes it can produce low p-values. The more searches you run, the more likely at least one of them will produce a low p-value just by random chance! We take this into account by plotting the expected statistical behavior for a search like this one (dashed black line) in the figures above, along with the margin of error for those expectations (dotted black lines). As long as the blue dots fall within the dotted lines, we conclude that our results are consistent with background noise and therefore do not show evidence of a signal. Both of these plots do not include GW170817A, which would be shown as an extreme outlier. (It’s p-value was roughly 9.38×10⁻⁵ for the modeled search, and 3.1×10⁻⁴ for the unmodeled search, respectively)
The future is bright, and not just in gamma rays!
So while we can report only one detection (which is in and of itself a remarkable feat), there is still much that we can learn about GRBs through study of their detectable gravitational wave emission (or lack thereof). And our results from the second observing run point towards a promising future for multi-messenger astronomy in our third observing run and beyond. There remain many mysteries surrounding these extreme and energetic events, and with those mysteries come many still-unanswered questions. As our gravitational wave detectors improve, and we observe more and more of these fascinating phenomena, we will continue to answer them. In the meantime, one thing is absolutely clear: this is an exciting time for astronomy.
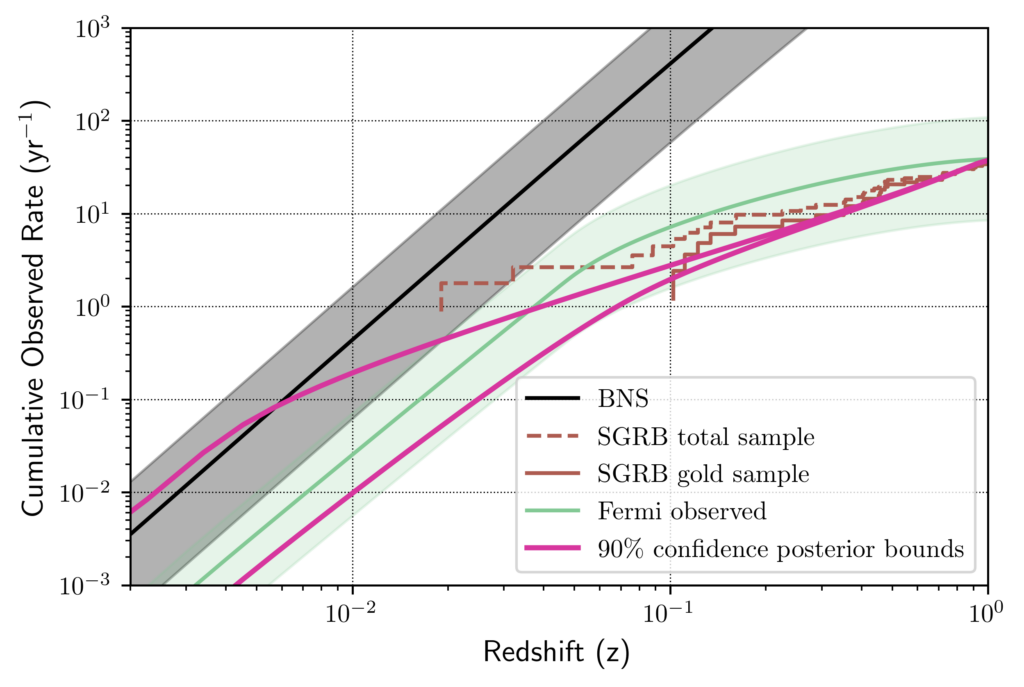
This final figure summarizes the expected rate of detection as a function of distance (represented here by “redshift” which is an observational property that is analogous to distance on cosmic scales). Even though we only detected one event (GW170817 / GRB170817A) we are still able to constrain the predicted event rate based on what we didn’t detect. The essential portion of this plot are the magenta lines, which represent the range of event rates that would be consistent with our results. Specifically: how many GRBs produced by binary neutron star mergers should be observed per year at a given distance.
This magenta “confidence” range can then further be compared to other important rate predictions. In black is the (optimistic) event rate that can be extrapolated by observations of binary neutron stars (but not GRBs) right here in our galaxy. In green is the rate inferred from observations of short GRBs by the Fermi satellite. Finally, in brown are rates set by the detection of GW170817/GRB170817A. Our magenta lines are consistent with other observations, supporting the hypothesis that short GRBs typically arise from binary neutron star mergers.
Find out more:
- Visit our websites: ligo.org, www.virgo-gw.eu
- Read the full article, free and online here